


Every transfer window, some version of the same comparison goes viral:
Cristiano Ronaldo cost €94M in 2009.
Hugo Ekitiké cost €94M in 2025.
The conclusion usually follows immediately:
Inflation.
And that is true. Just not in the way most football fans think.
Something clearly happened. Because “inflation” is doing an enormous amount of work in that argument.
Behind that one word, however, sit three related but very different concepts — and football debates quietly mix them together.
The euro itself loses value. A euro today buys less than a euro in 2009. Ronaldo’s fee looks smaller every year without football changing at all — the measuring stick shrank.
Football’s own prices rise faster than everything else. The way housing or tuition can outrun general prices, transfer fees can outrun bread and rent. That is a property of the transfer market, not of the euro.
The player behind the fee changes. €95M bought a 24-year-old reigning world’s best in 2009 and a promising winger in 2022. If the product changes, the price comparison means something completely different — statisticians call this the quality-adjustment problem, and it haunts every inflation number you have ever read.
Three concepts.
One word.
So for today’s piece, I went through 28,000 paid transfers to separate the three and show what each one actually tells us about the transfer market. Then, at the end, I put them back together and return to the famous Ronaldo comparison.
Because the meme is not completely wrong. It is just much more misleading than it first appears.
Let’s get into it.
1. The money: your memory of prices is broken
Start with the boring one. The euro itself.
The cumulative euro-area inflation since 2009 is roughly 43%. That means any fee from 2009 is understated by almost half when you read it with 2026 eyes.
Here is what the famous world-record transfers look like once you restate every fee in today’s euros:
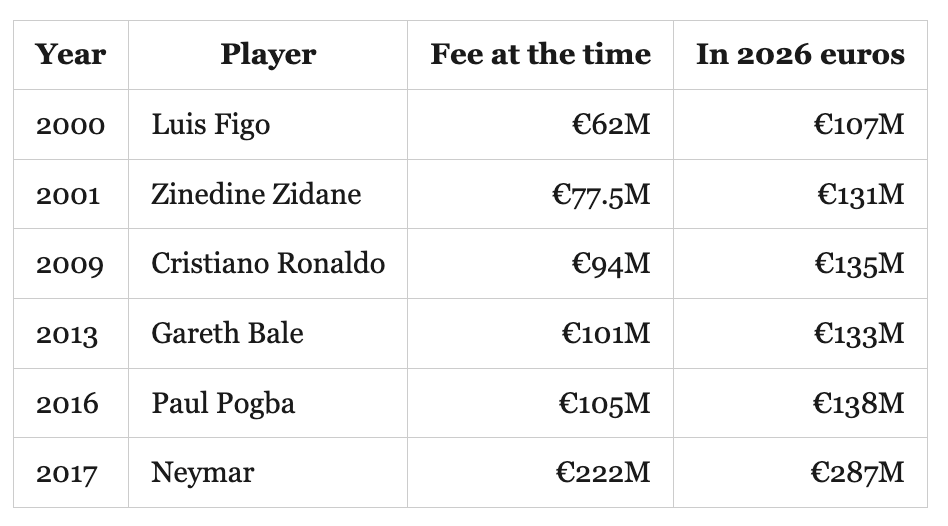
Look at the first five numbers. €107M. €131M. €135M. €133M. €138M.
For sixteen years, the real price of the most expensive player on Earth barely moved. The nominal record kept climbing. The real record really didn’t.
Then Neymar happened — €222M in 2017, about €287M in today’s money — and nothing has come close since.
Which means the real world record has been quietly falling for nine years, eaten by ordinary inflation. And the same correction reshuffles the top 20 all-time list:
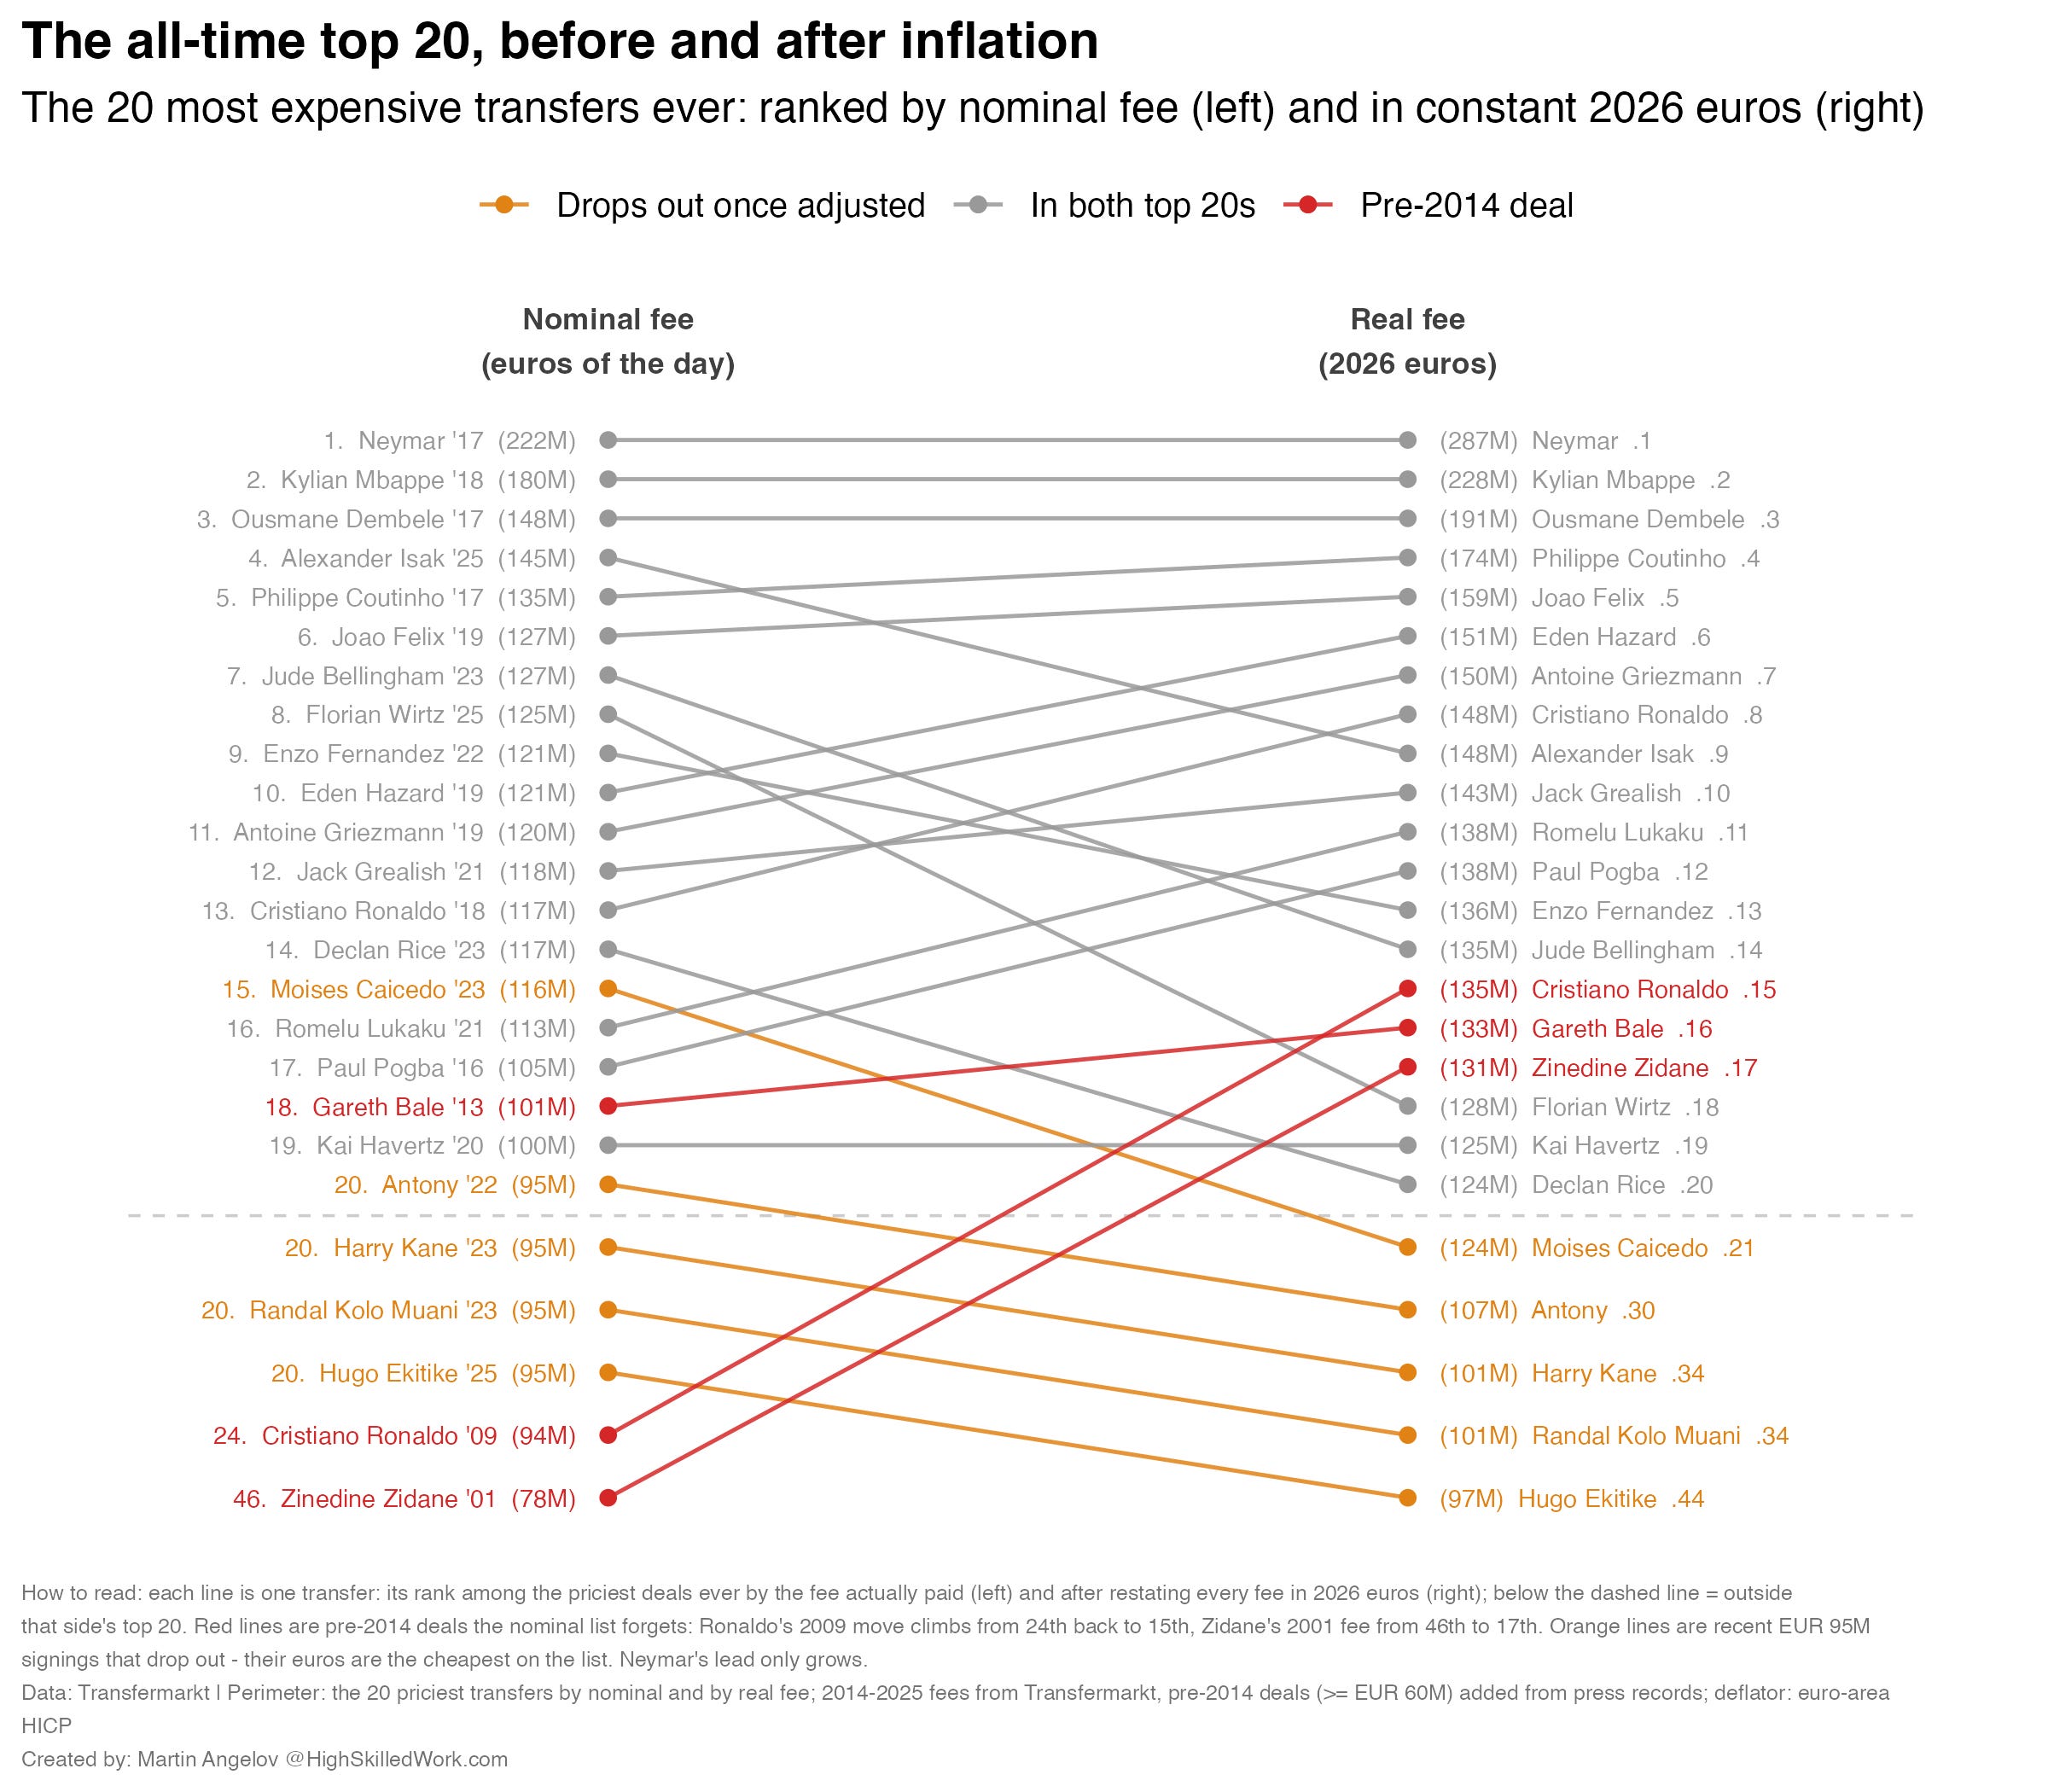
Ronaldo’s 2009 move climbs from 24th back into the top 15. Zidane jumps from 46th to 17th — above Wirtz, above Havertz. And a group of recent €95M signings falls out of the top 20 entirely, because their euros are the cheapest euros on the list.
The first confusion
Comparing prices from different years without converting the money is not an opinion about football. Sure it will get you clicks on social media. But above all it is a measurement error.
And at the very top of the transfer market, fixing that one error explains more of the “fees went crazy” feeling than almost anything else.
2. The market: football’s own inflation
Now the more interesting question. After removing ordinary inflation, did football itself get more expensive?
This is the second concept — a relative price change — and it is where measurement gets genuinely tricky.
To measure it properly, borrow the tool economists built for exactly this job.
The CPI — the Consumer Price Index. It is the number governments actually publish when they announce “inflation was 2% this year”. And it works in a deliberately boring way. Statisticians define a fixed basket of goods — bread, rent, haircuts, train tickets — and then price the same basket, year after year.
Not the average thing people happened to buy. The same basket.
That fixed basket is what makes inflation numbers comparable over time: if the basket changed every year, you would never know whether prices moved or the shopping list did.
Football’s version is not a fixed basket. It is a fixed market rank.
Every season has a 10th-biggest signing, a 25th-biggest, a 100th-biggest. Those positions exist every year, no matter how many small deals enter the database. A crude football CPI.
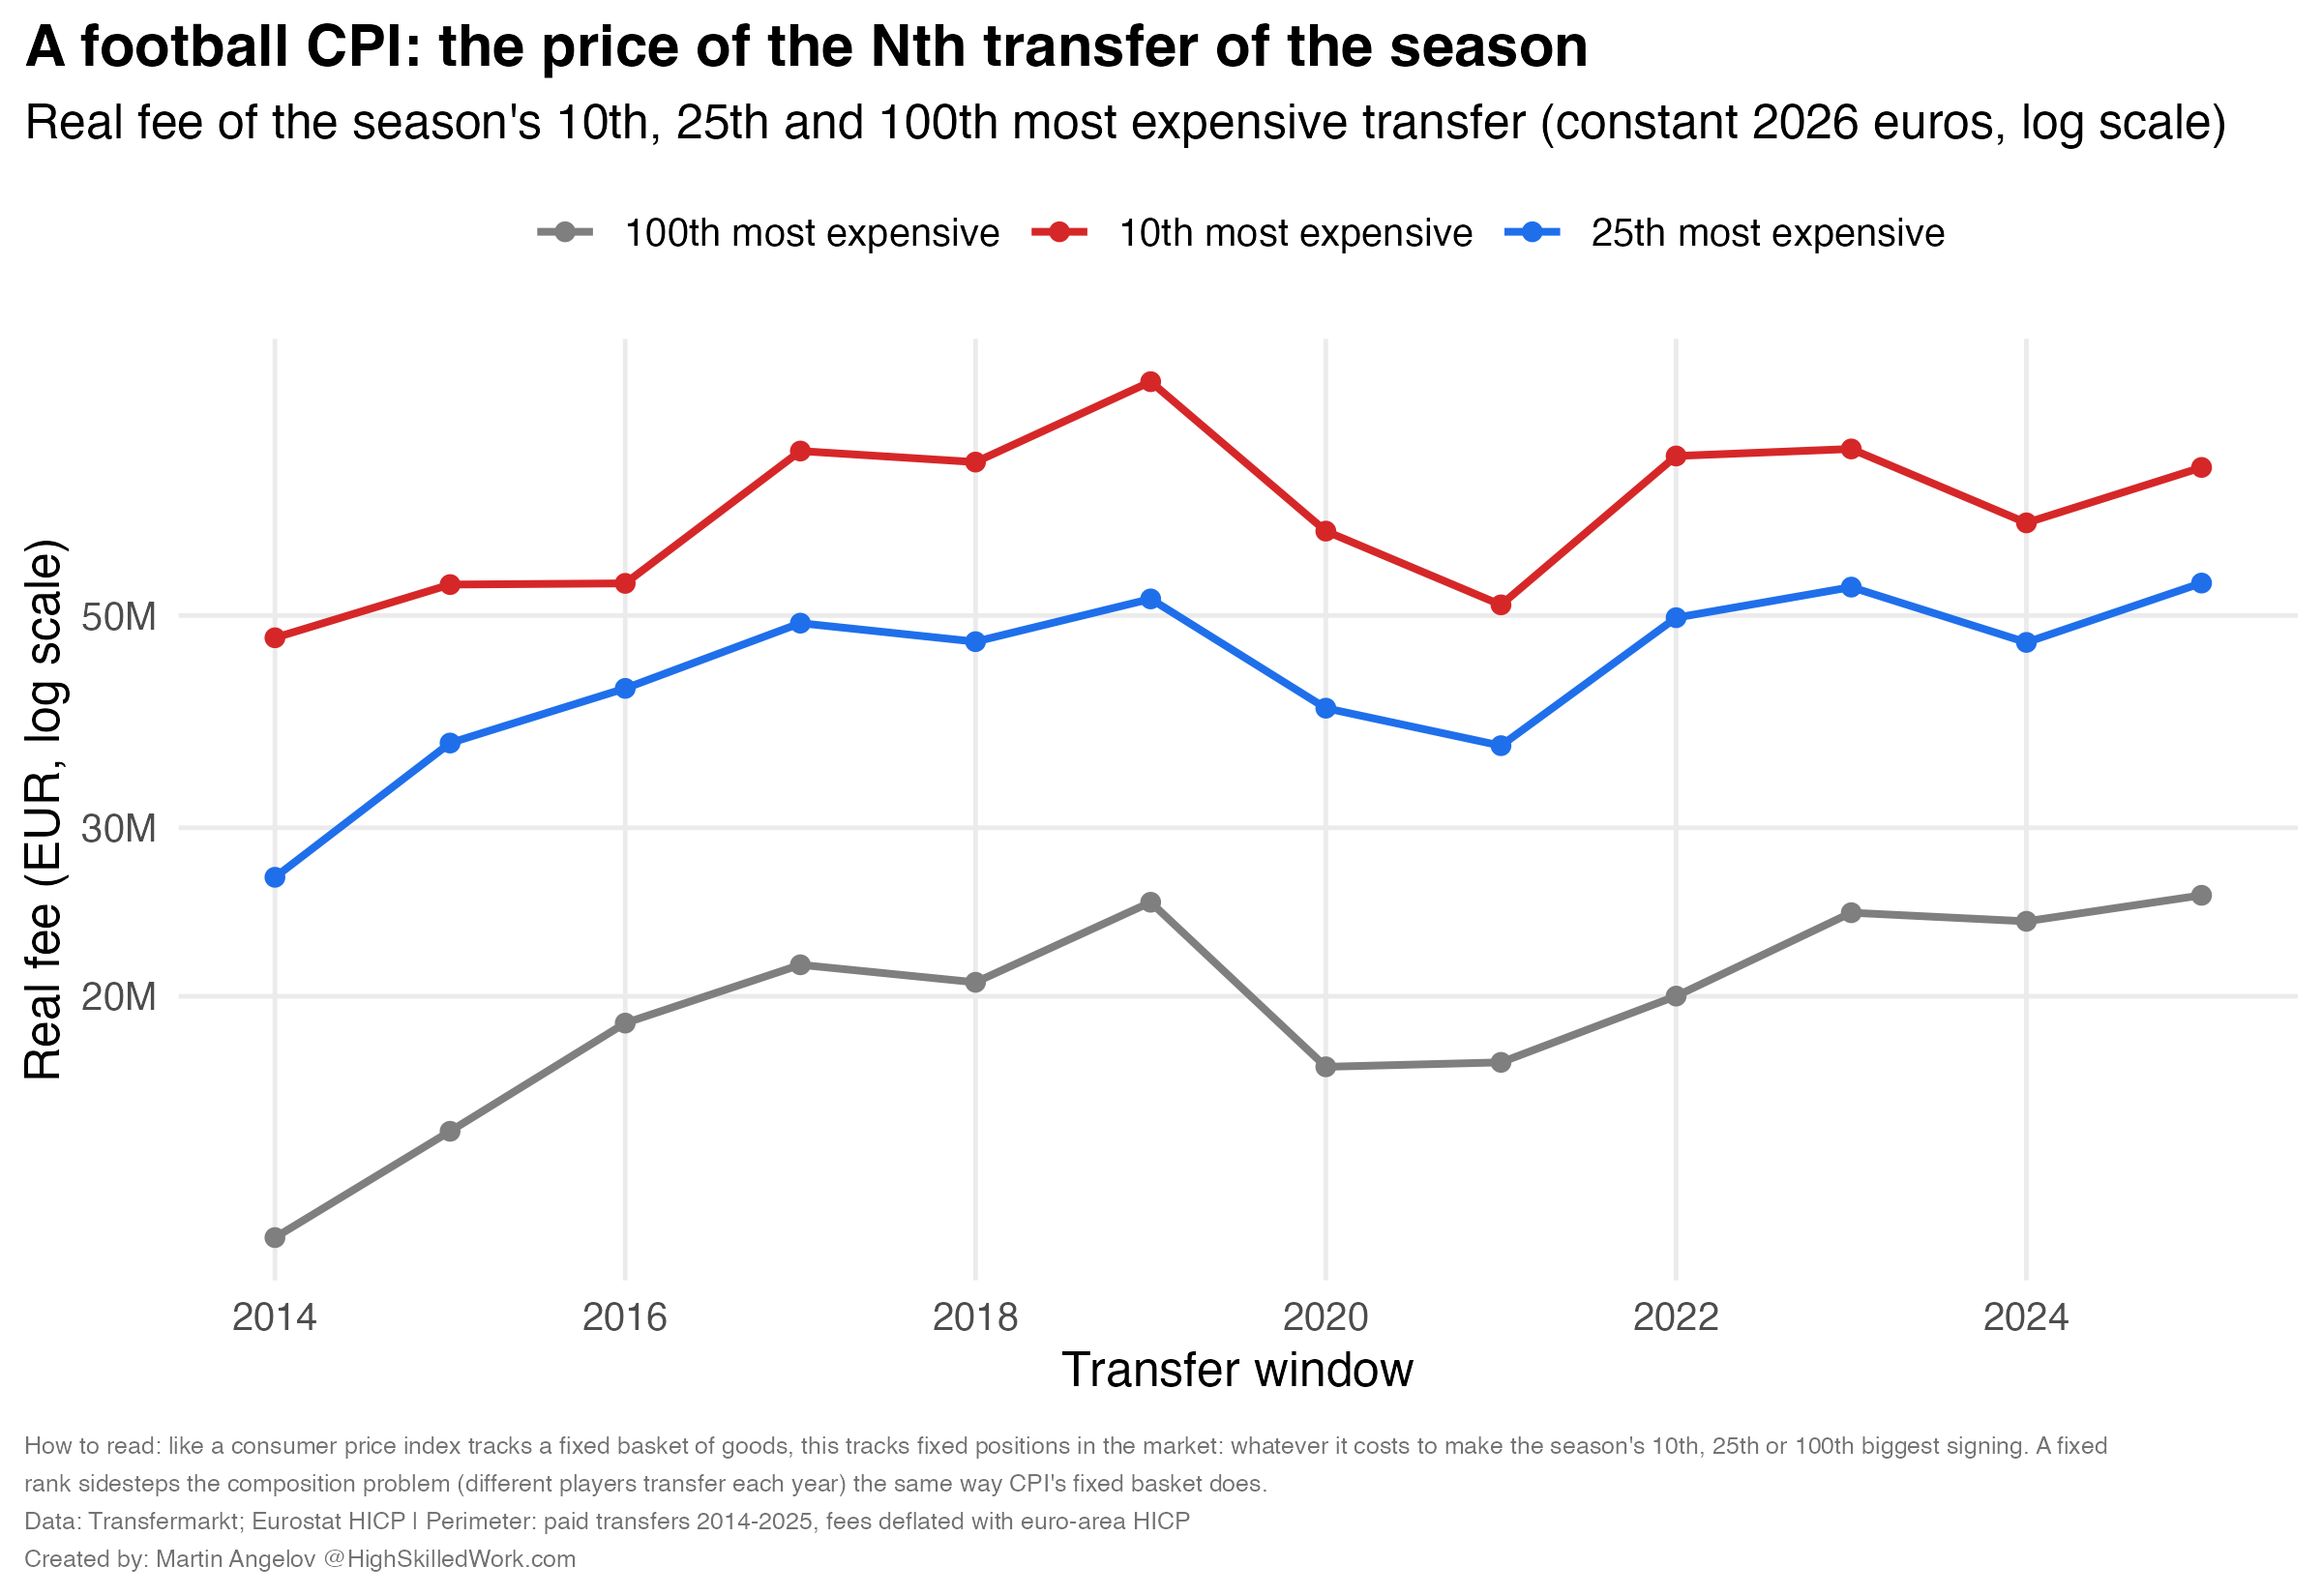
In constant 2026 euros:
the season’s 10th-biggest signing: €47M in 2014 → €71M in 2025 — +51% real
the 25th-biggest: €27M → €54M — +103% real
the 100th-biggest: €11M → €26M — +128% real
So football inflation is very real. It just lives in a different place than people look.
Here’s another way to illustrate the same idea. The figure below presents the number of transfers between €50M-€100M and above €100M.
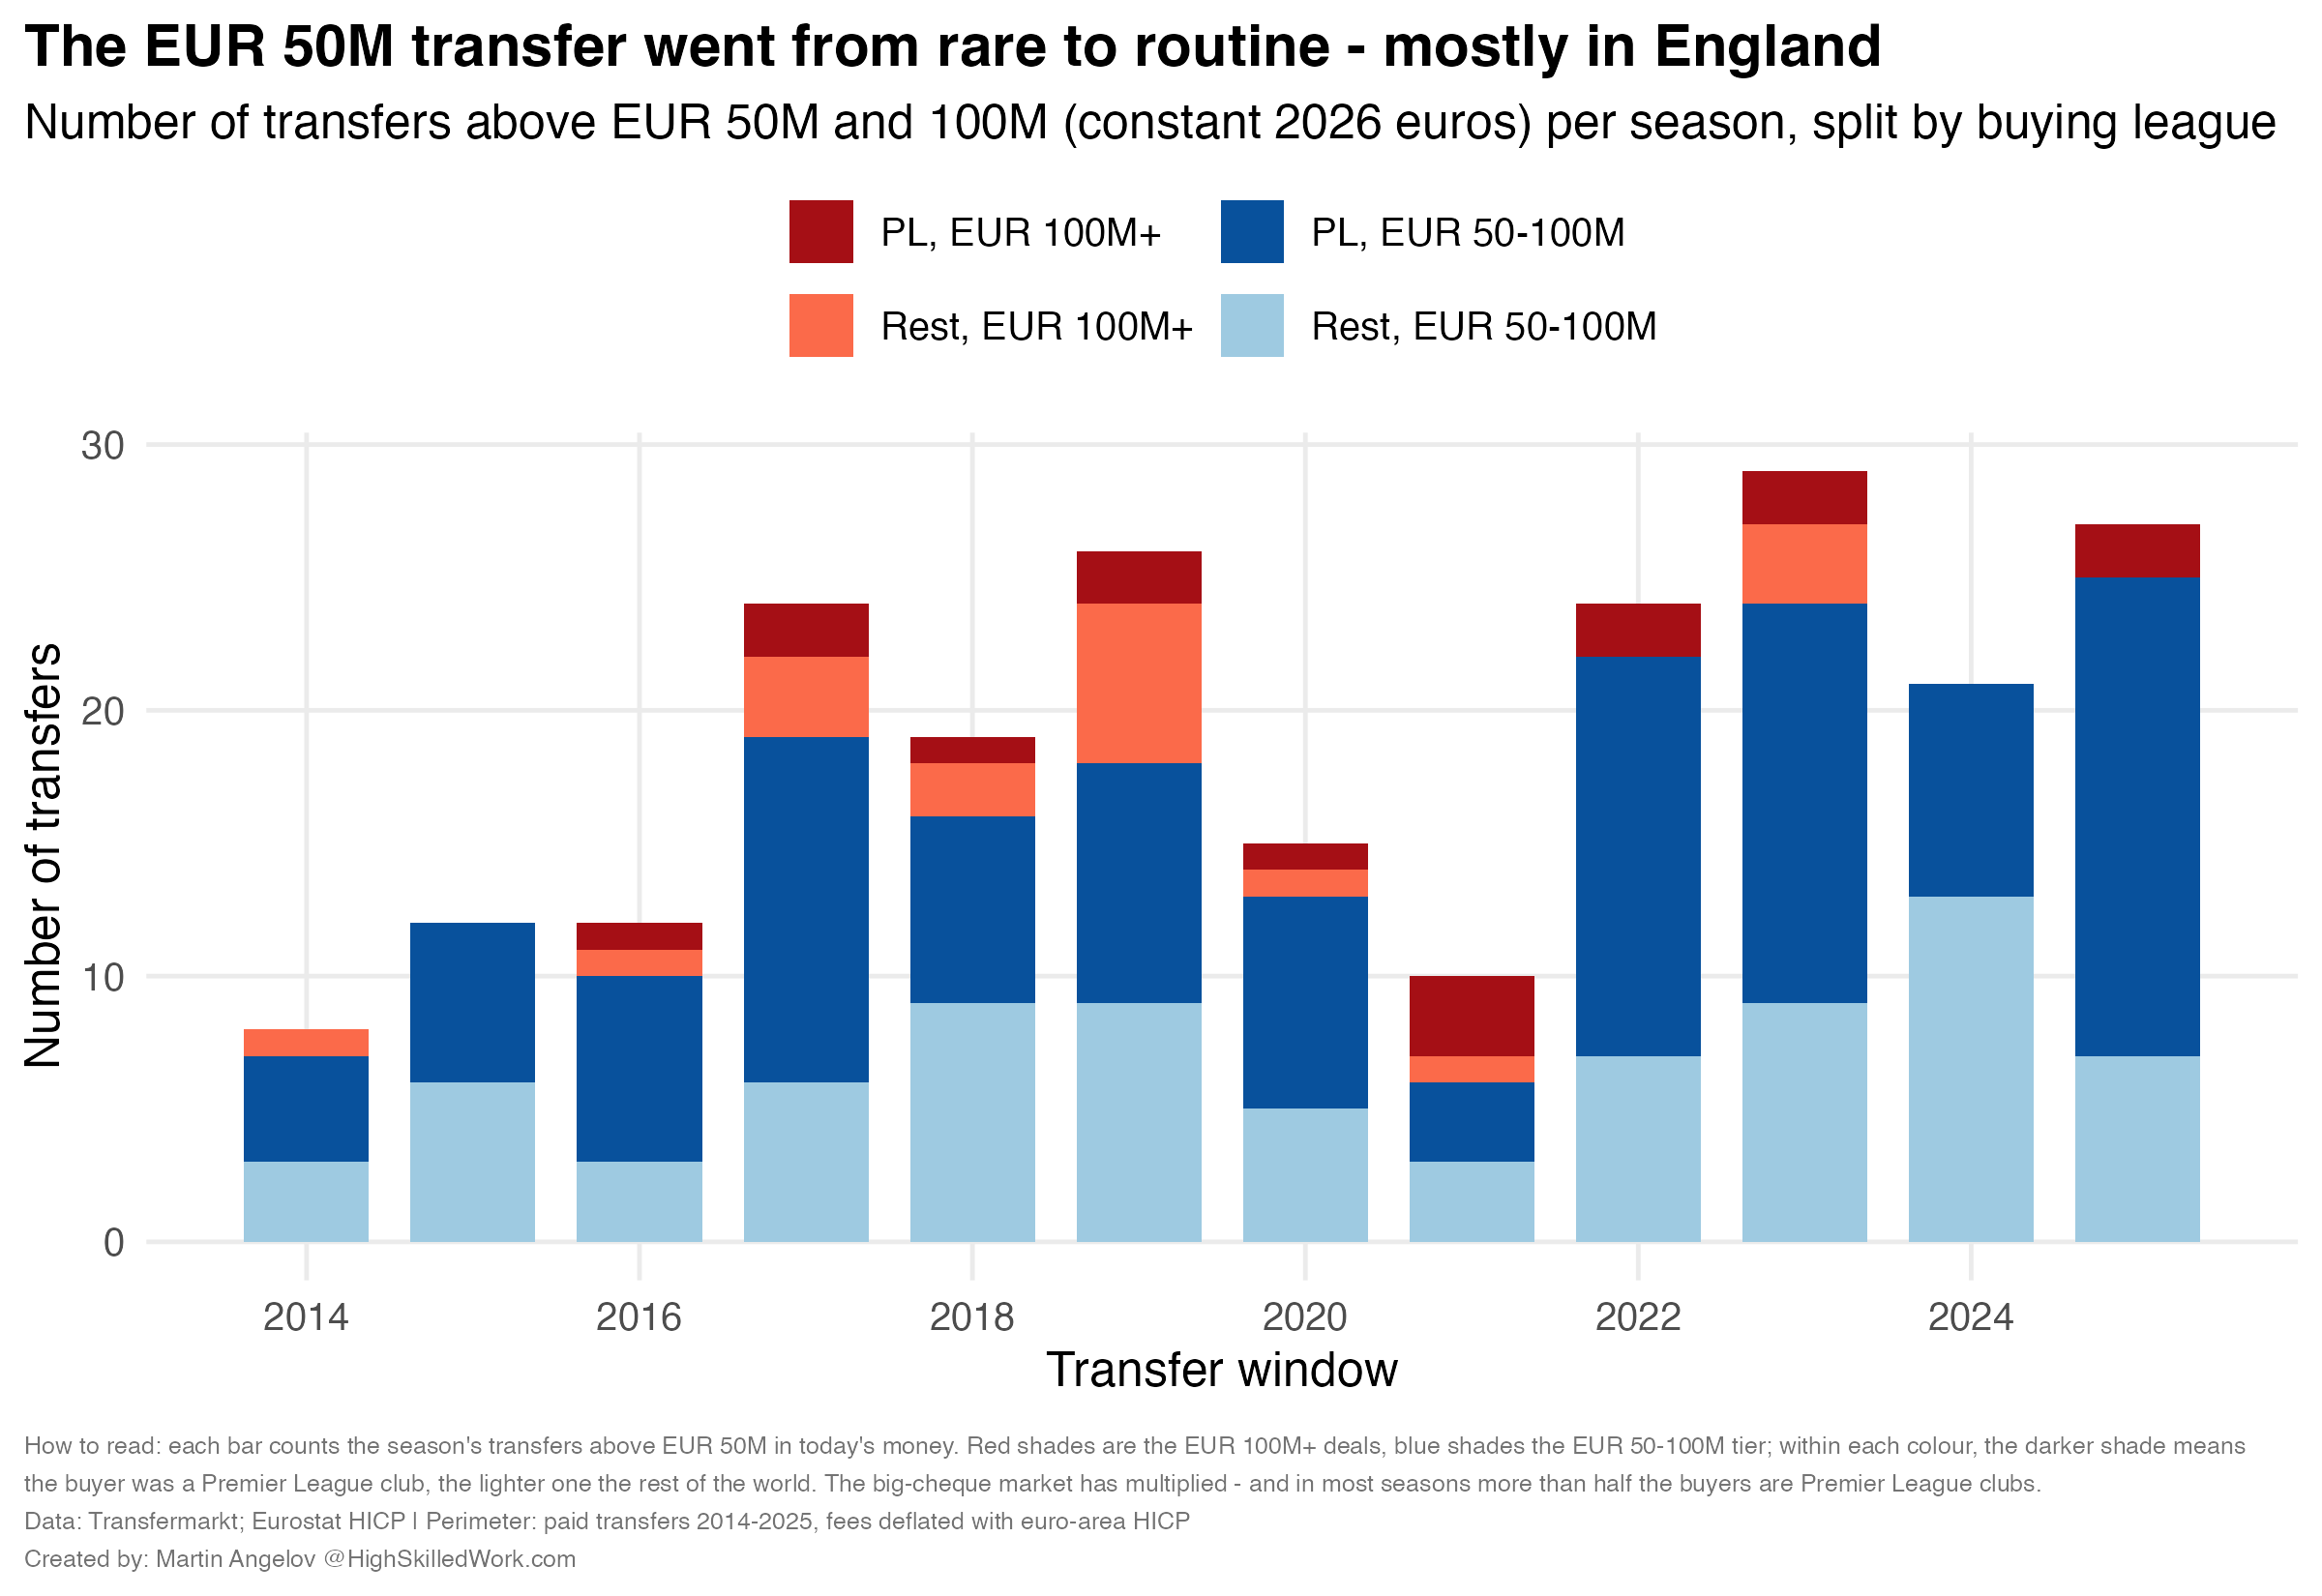
In 2014 there were 8 transfers above €50M in today’s money. Recent seasons run at 21 to 29.
And in most seasons more than half of the buyers are Premier League clubs. Which raises the obvious question.
Where is all this money coming from?
Follow the money: the TV cheque
Mostly from one place. Television. And especially from England.
And since this whole piece runs on constant 2026 money, let’s hold the TV deals to the same standard and strip ordinary UK inflation out of them too.
When the Premier League launched in 1992, its broadcast rights were worth about £0.1 billion a season in today’s pounds.
The current cycle is worth about £3.8 billion a season. Thirty-eight times more. After inflation.
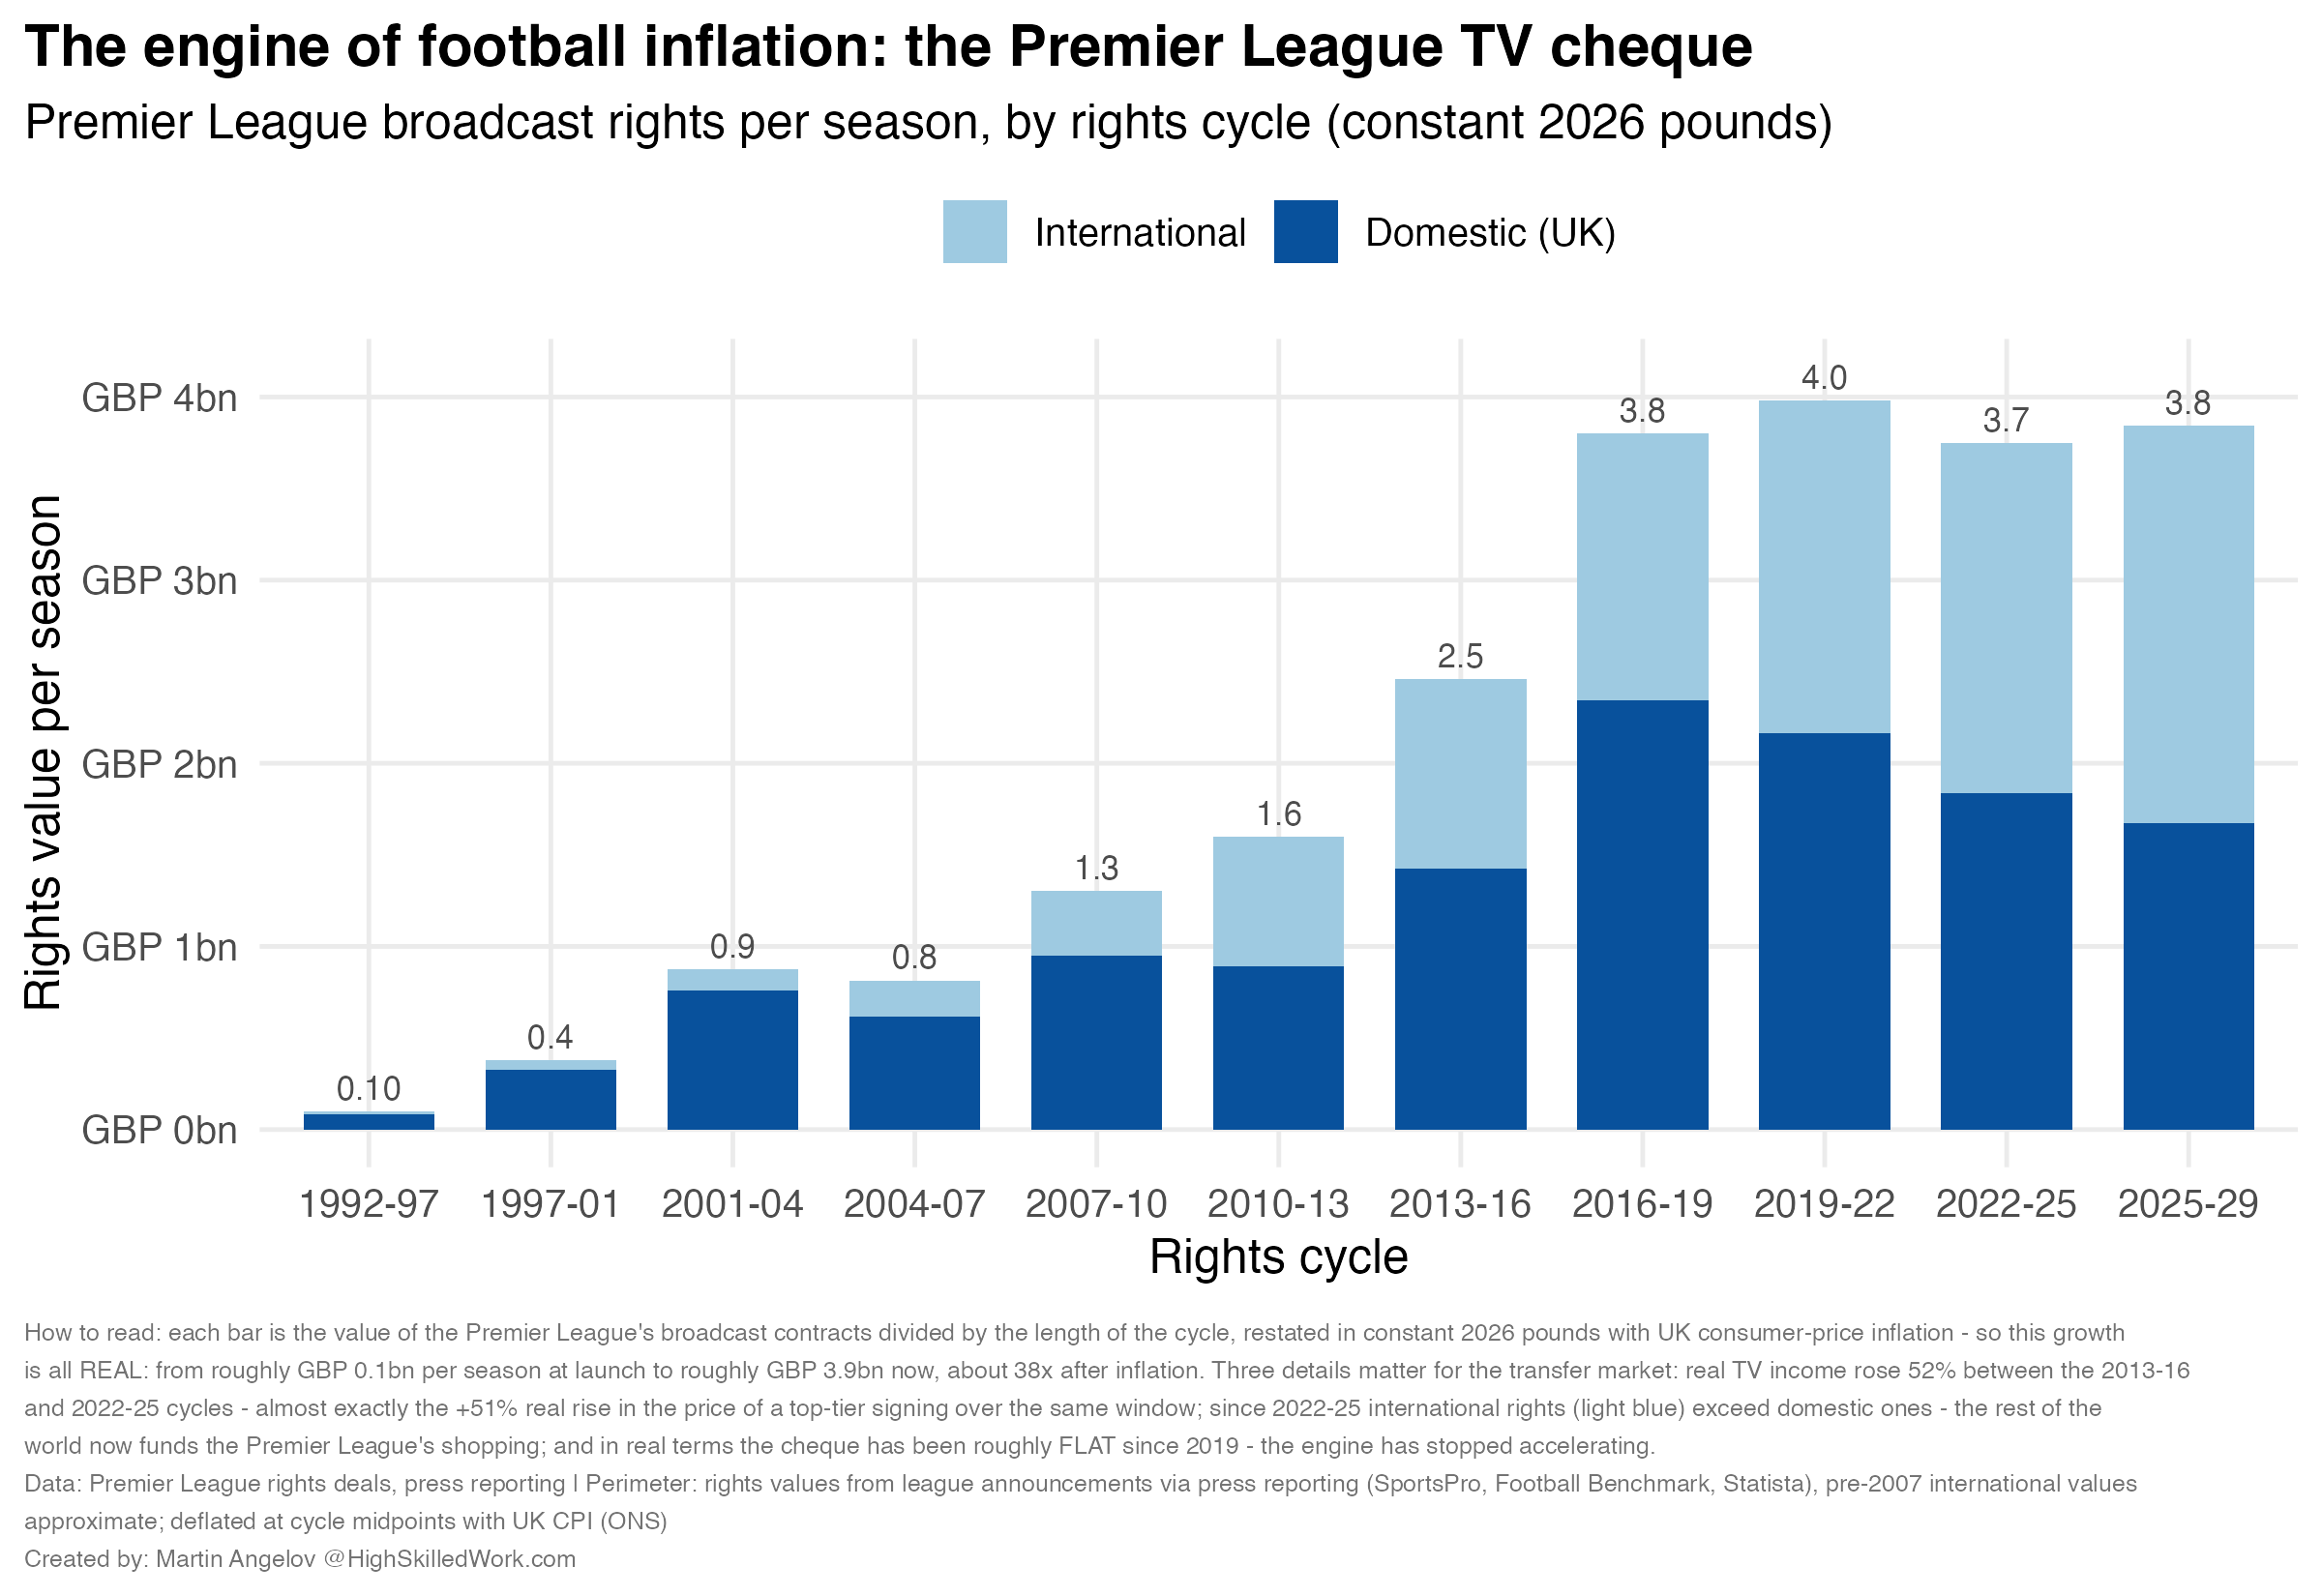
Three details in that chart matter for transfer fees.
First, the timing. Between the 2013–16 cycle and the 2022–25 cycle, the Premier League’s real TV income rose 52%. The real price of a top-tier signing rose 51% over the same window.
Coincidence? Same period, same magnitude — the fees track the cheque.
Second, the source. Since the 2022–25 cycle, international rights are worth more than domestic ones. The rest of the world is now funding the Premier League’s shopping.
Third — and easy to miss — the plateau. In real terms, the TV cheque has been roughly flat since 2019. The engine that inflated the transfer market has stopped accelerating. If fee inflation cools over the next few cycles, this chart is why.
Now translate the cheque into spending power.
Split it across twenty clubs and every Premier League club starts the season with roughly £150–175M of central broadcast income. Before selling a single ticket or shirt.
For scale: the median Premier League club’s entire wage bill is about €84M. The median club in Spain, Italy or Germany runs on €33–36M.
So the Premier League’s TV cheque alone hands each of its clubs more than the full wage bill of a typical Serie A or La Liga club — several times over.
And that explains where football transfer inflation comes from. The €25–70M tier is the shelf where Premier League clubs shop. Not just the big six — all twenty. Brentford and Bournemouth can pay fees that only champions could pay elsewhere.
Twenty clubs, armed with broadcaster money, bidding mostly against each other for the same pool of players.
Prices follow.
The second confusion
Sector inflation is about the market, and it cannot be measured with a naive average. Price fixed positions instead — the way a CPI prices a fixed basket — and the answer is clear. The 25th signing of the season costs twice as much in real terms as it did in 2014. That is football’s real inflation rate. And its engine has a name: the Premier League TV deal.
3. The product: the same money buys a different player
Now the third concept. The one almost nobody names, even though professional statisticians fight it every day.
When the price of “a phone” looks stable for a decade, is that zero inflation? The 2026 phone is not the 2016 phone. The product changed under the price.
Statisticians call this quality adjustment, and it is the hardest part of their job.
Football has exactly this problem. Because the thing a €100M fee buys today is not the thing it bought ten years ago. Here are three tests to illustrate the point.
Test one: rank the players at the moment of purchase
For every €20M+ transfer into a top-five league since 2017/18, I took the player’s season immediately before the move and ranked him against every top-five-league player in his positional family — a composite score built from position-specific output metrics.
The individual scores are not the point. The distribution is.
For the same inflation-adjusted fee, are clubs buying higher-ranked or lower-ranked players than before?
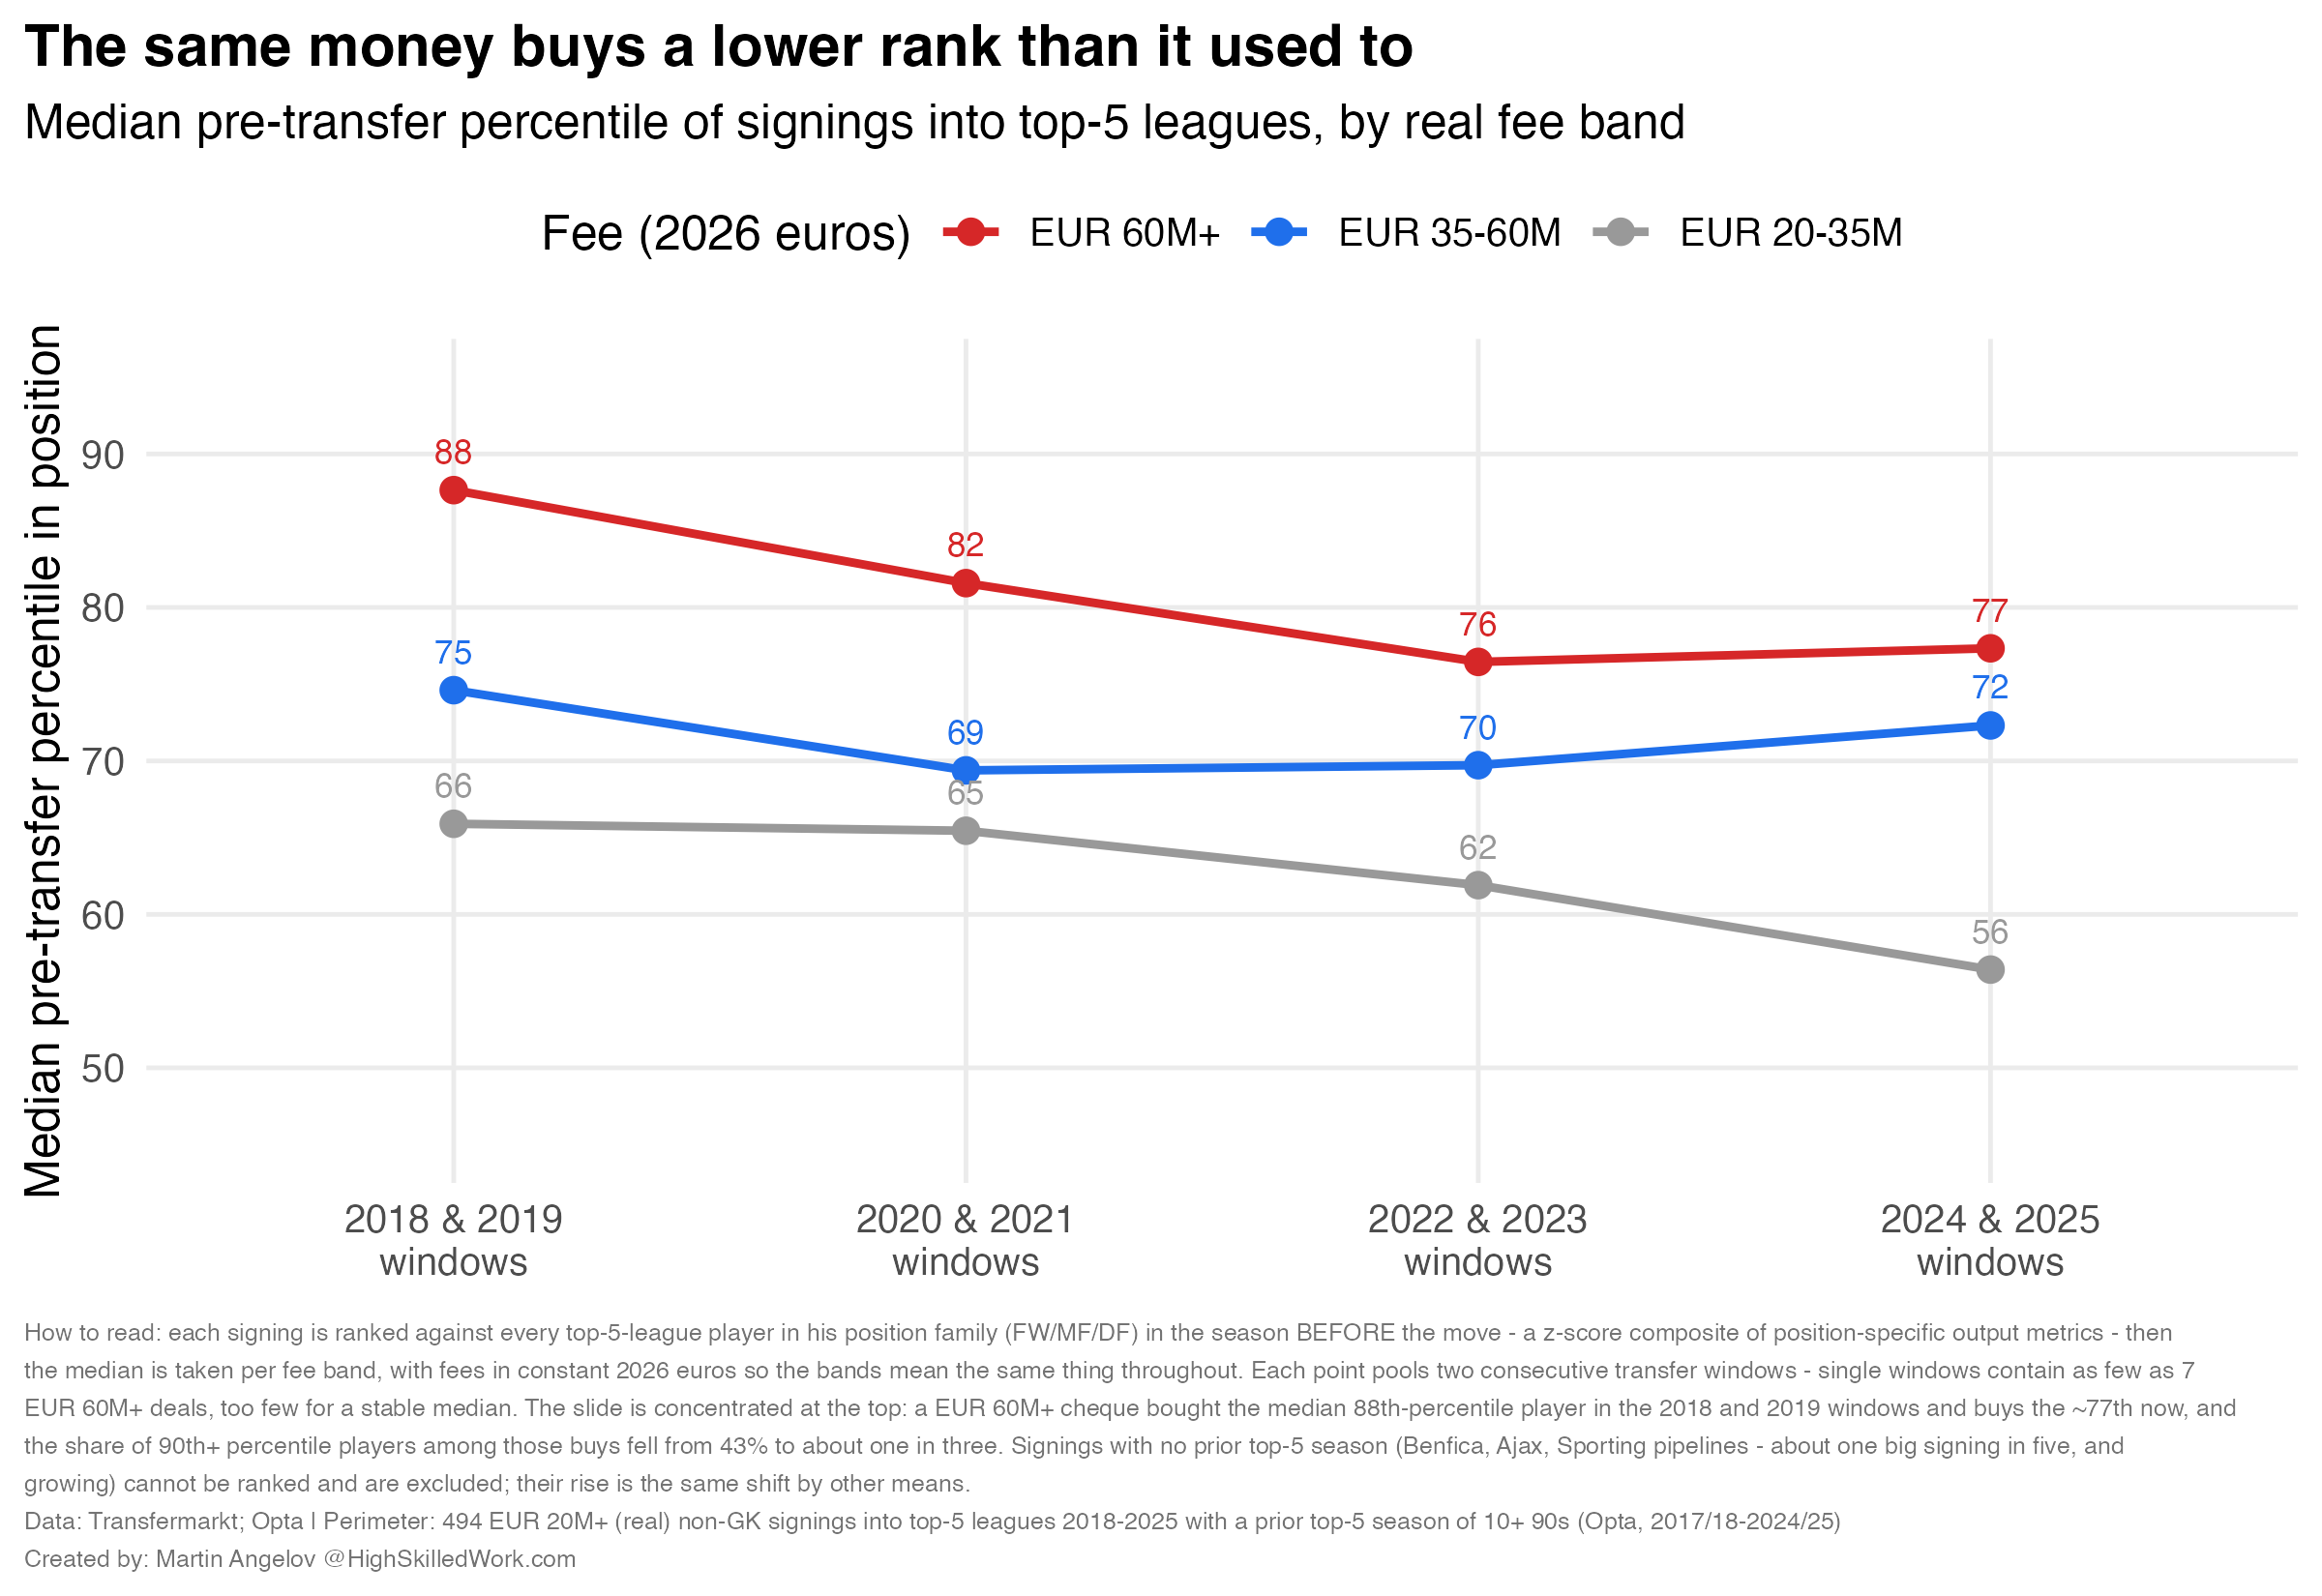
Lower.
In 2018–19, the median €60M+ signing ranked around the 88th percentile of his position. Today, closer to the 77th.
The share of genuinely top-decile players among those buys fell from 43% to about one in three.
And note where the slide happens: the €35–60M tier barely moved. The change is concentrated in the biggest cheques.
One caveat. This chart can only understate the shift due to a limitation in my data which only has Top 5 (England, Spain, Germany, Italy, France) leagues data. Because one big signing in five has no top-five-league season to rank at all.
João Félix. Enzo Fernández. Antony. Darwin Núñez. Frenkie de Jong.
Mostly from the same pipeline: Benfica, Ajax, Sporting, Porto.
Elite prices, paid before an elite body of evidence exists.
Test two: age
The market as a whole did not get younger — about half of all paid transfers involve a player 23 or under, stable for twelve years.
What changed is who the big cheques go to.
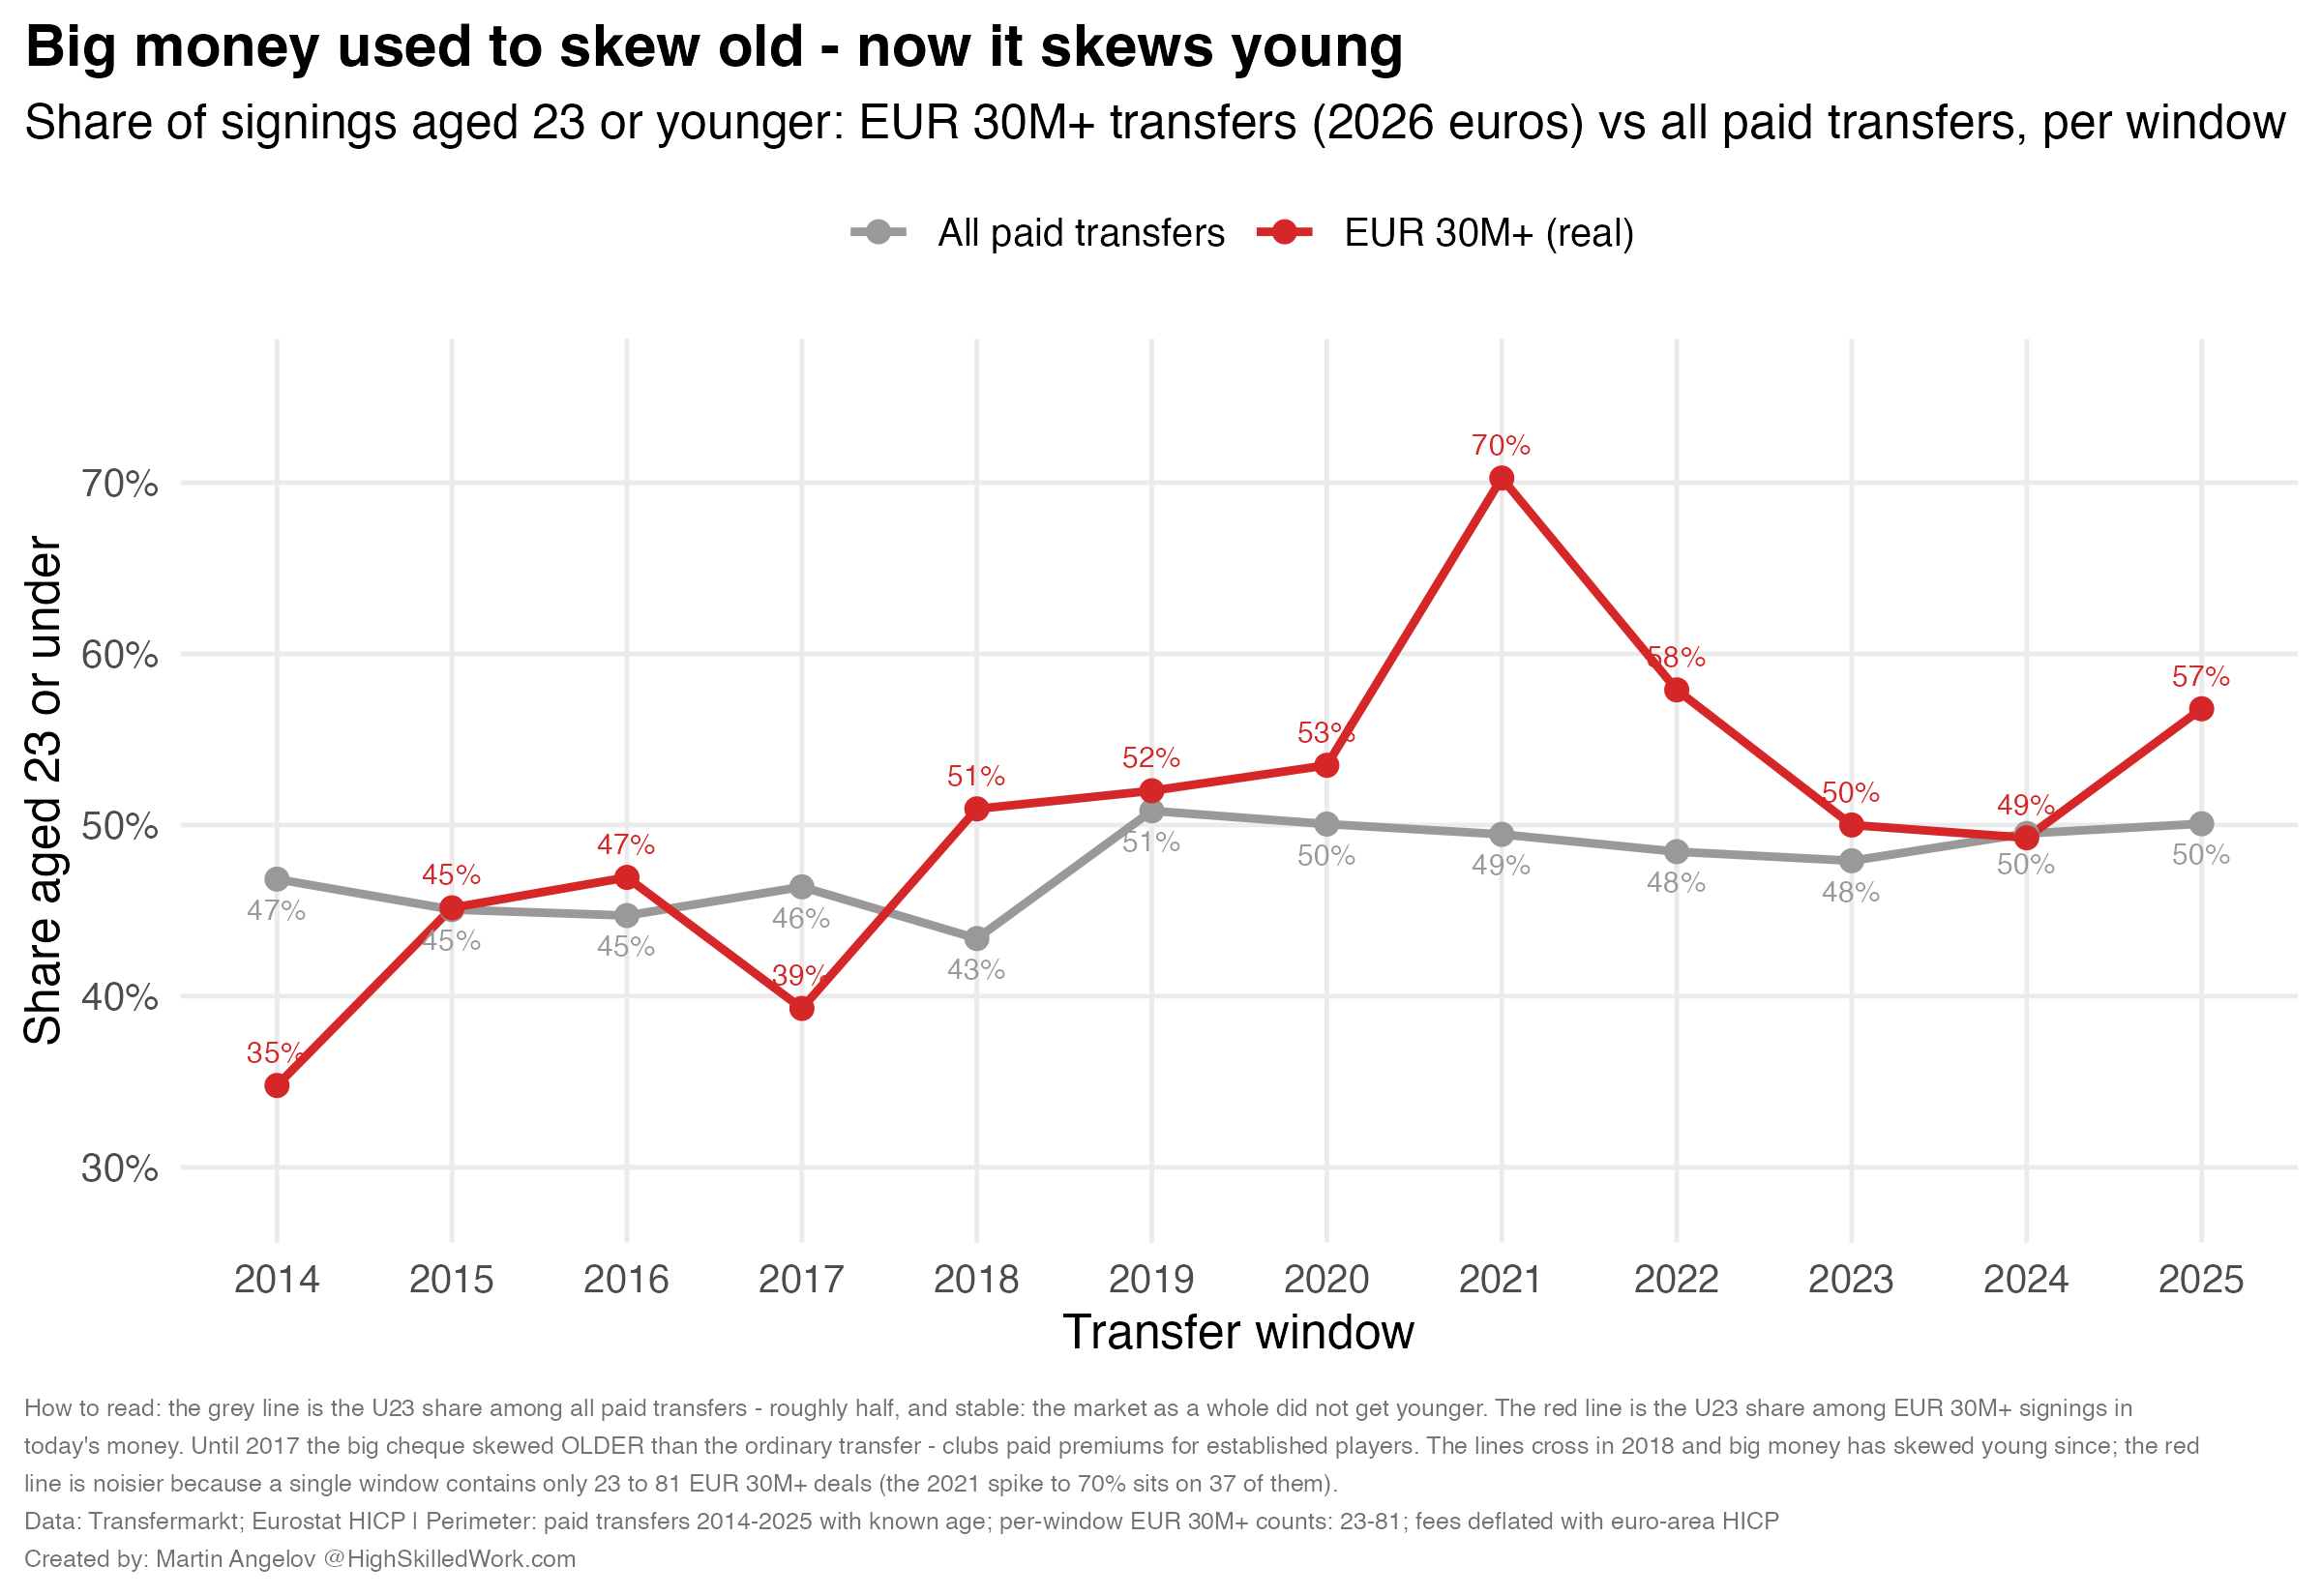
Until 2017, a €30M+ signing was less likely to be 23 or yonger than an ordinary transfer. The big fee was a prize for the established player. Youth was what you bought cheap.
The lines cross in 2018–19.
They have not crossed back (if it wasn’t for the 2024/25 season which kind of ruined my beautiful conclusion).
Test three: forget my models — use the Ballon d’Or
For every €60M+ transfer since 2014, one simple question.
Had the player already finished in a Ballon d’Or top 10 before the move?
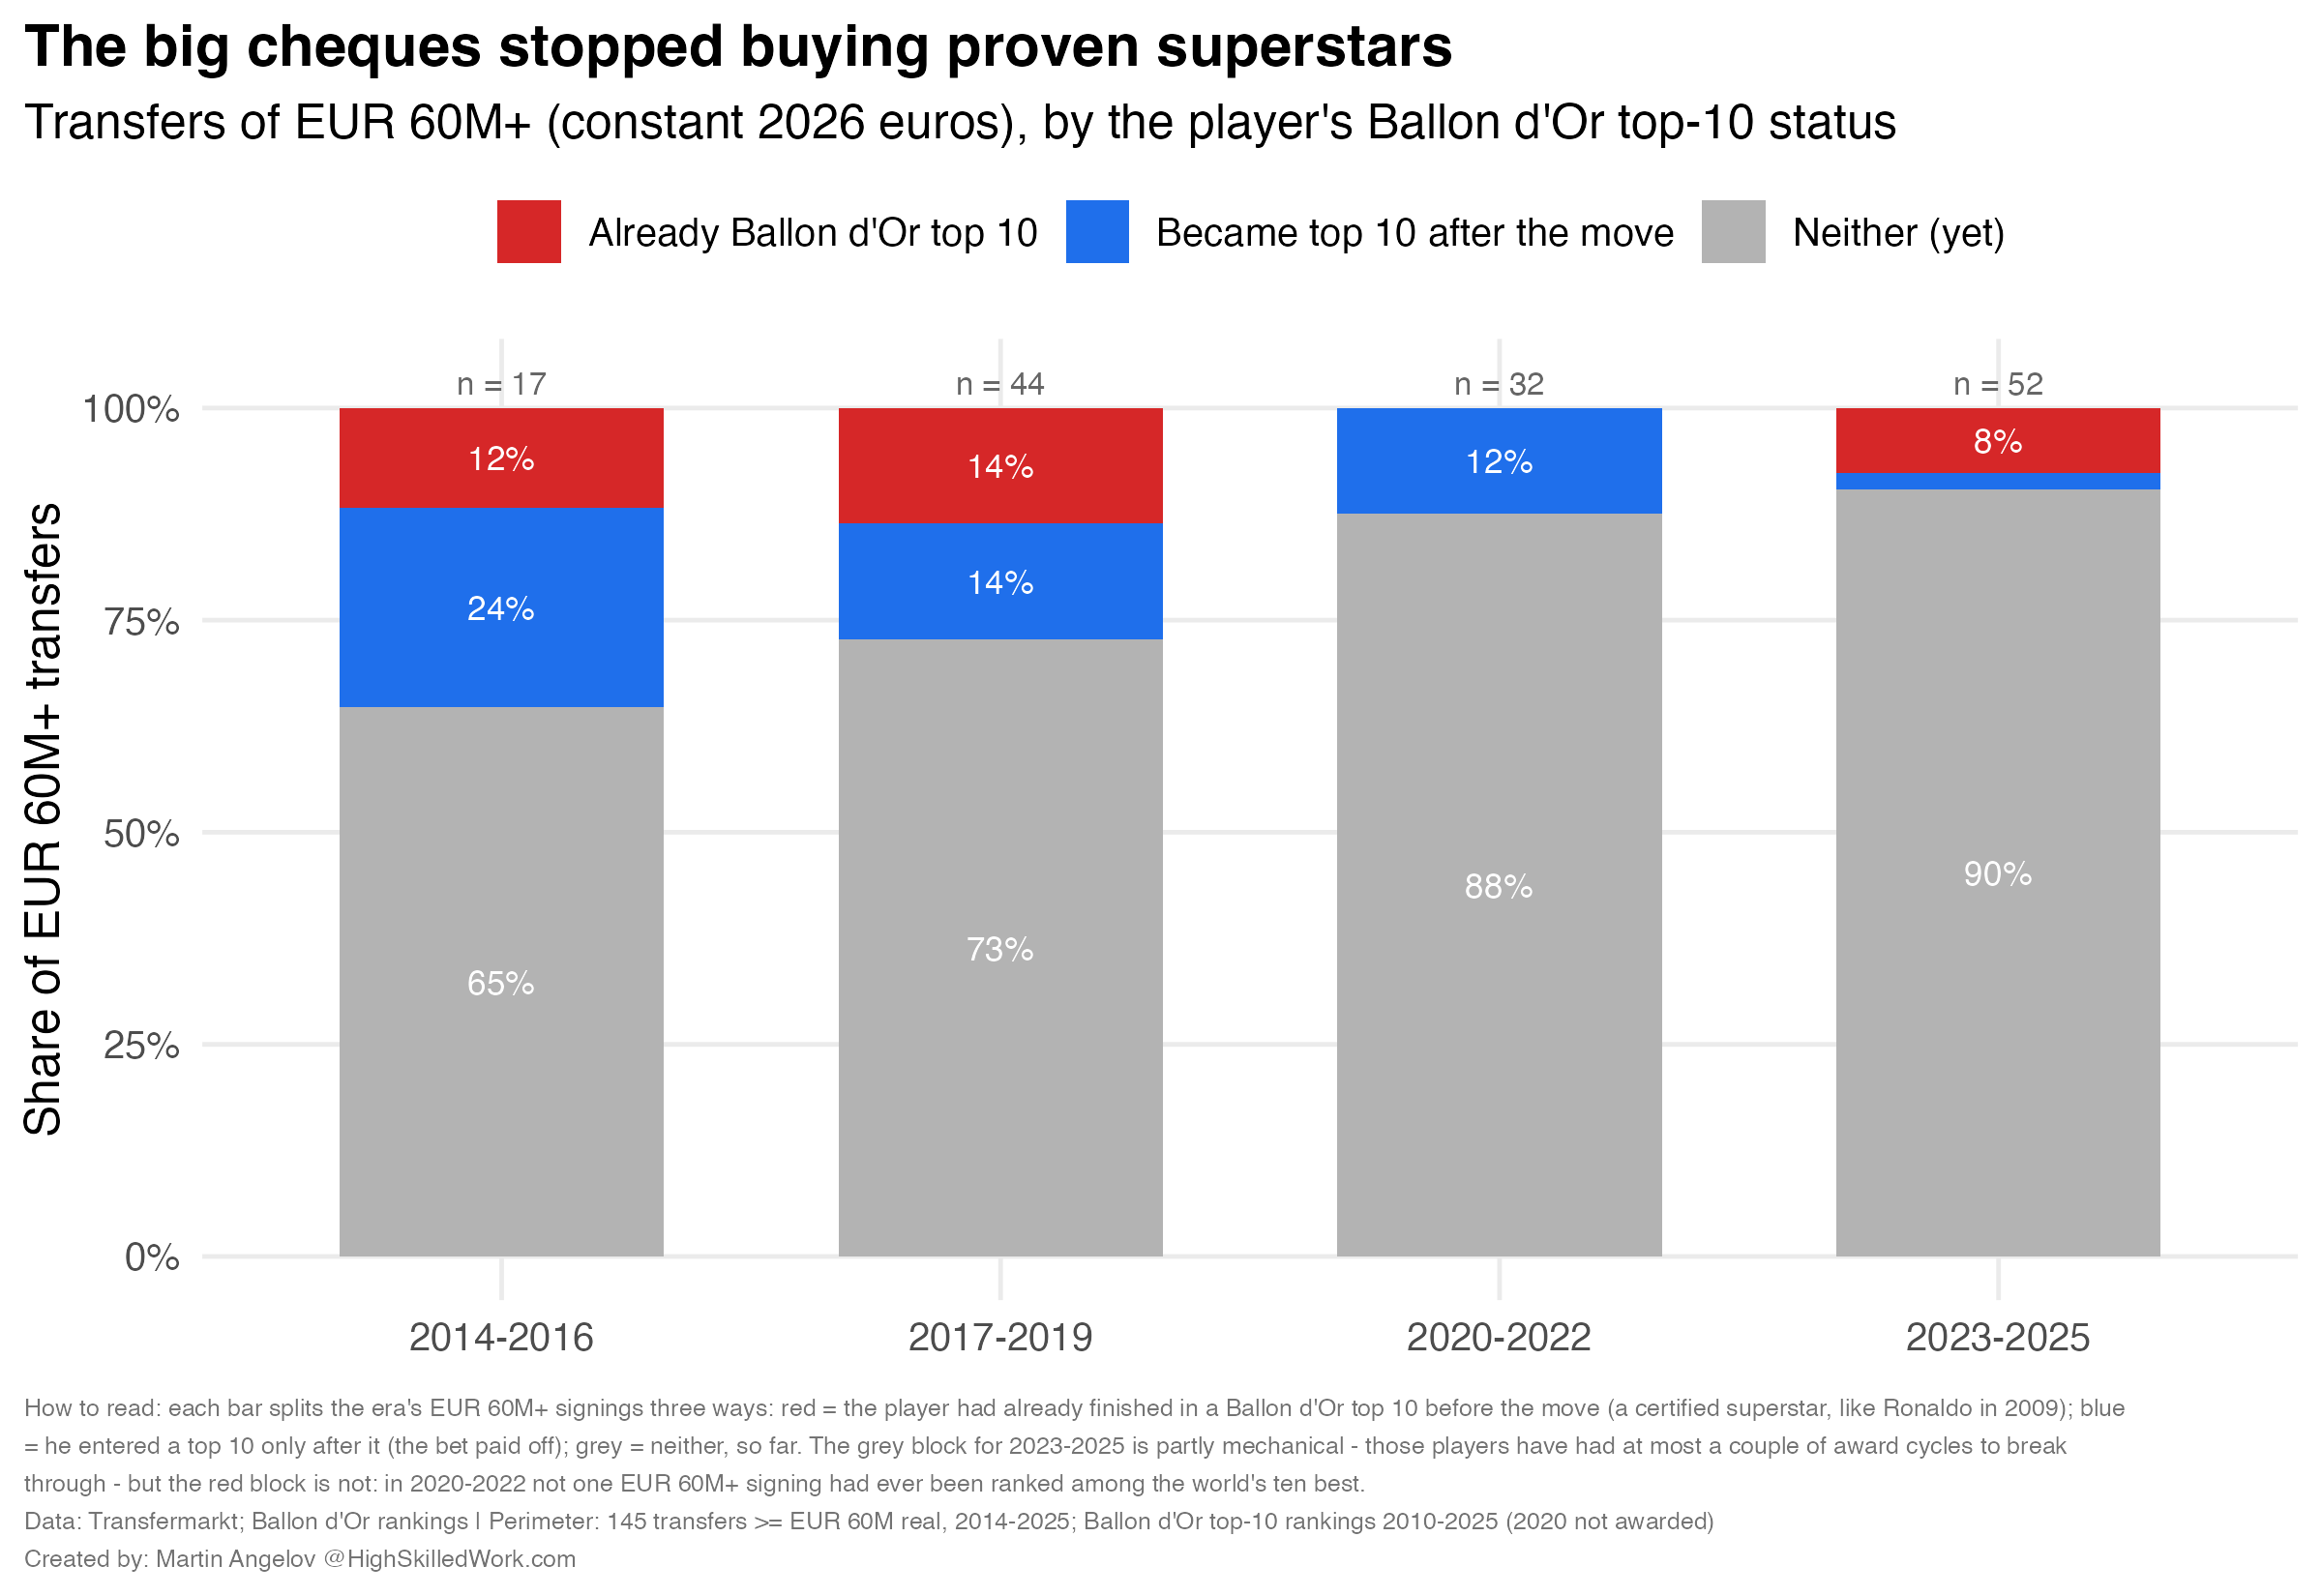
Between 2014 and 2019, buying a certified superstar was normal. Suárez to Barcelona. Neymar to PSG. Ronaldo to Juventus. Hazard and Griezmann in 2019.
Between 2020 and 2022?
Zero.
Not one €60M+ transfer involved a player who had ever been ranked among the world’s ten best.
And the few that appear since are farewell tours: Kane at 30, Neymar to Saudi Arabia at 31.
Where did the superstars go? The Messis, Benzemas, Ramoses.
All of them eventually changed clubs. None of them appears in eleven years of paid-transfer data.
They left on free transfers — running down contracts and capturing the fee themselves, as wages and signing bonuses.
The third confusion
Quality change is about the product. A price that looks stable — or crazy — means nothing until you check whether the thing being bought is still the same thing.
In football it is not.
The €100M+ fee used to buy proof. Now it buys probability.
4. All three at once: the most famous price in football
Now we can run the full decomposition on the number everyone argues about.
Ronaldo, 2009, €94M.
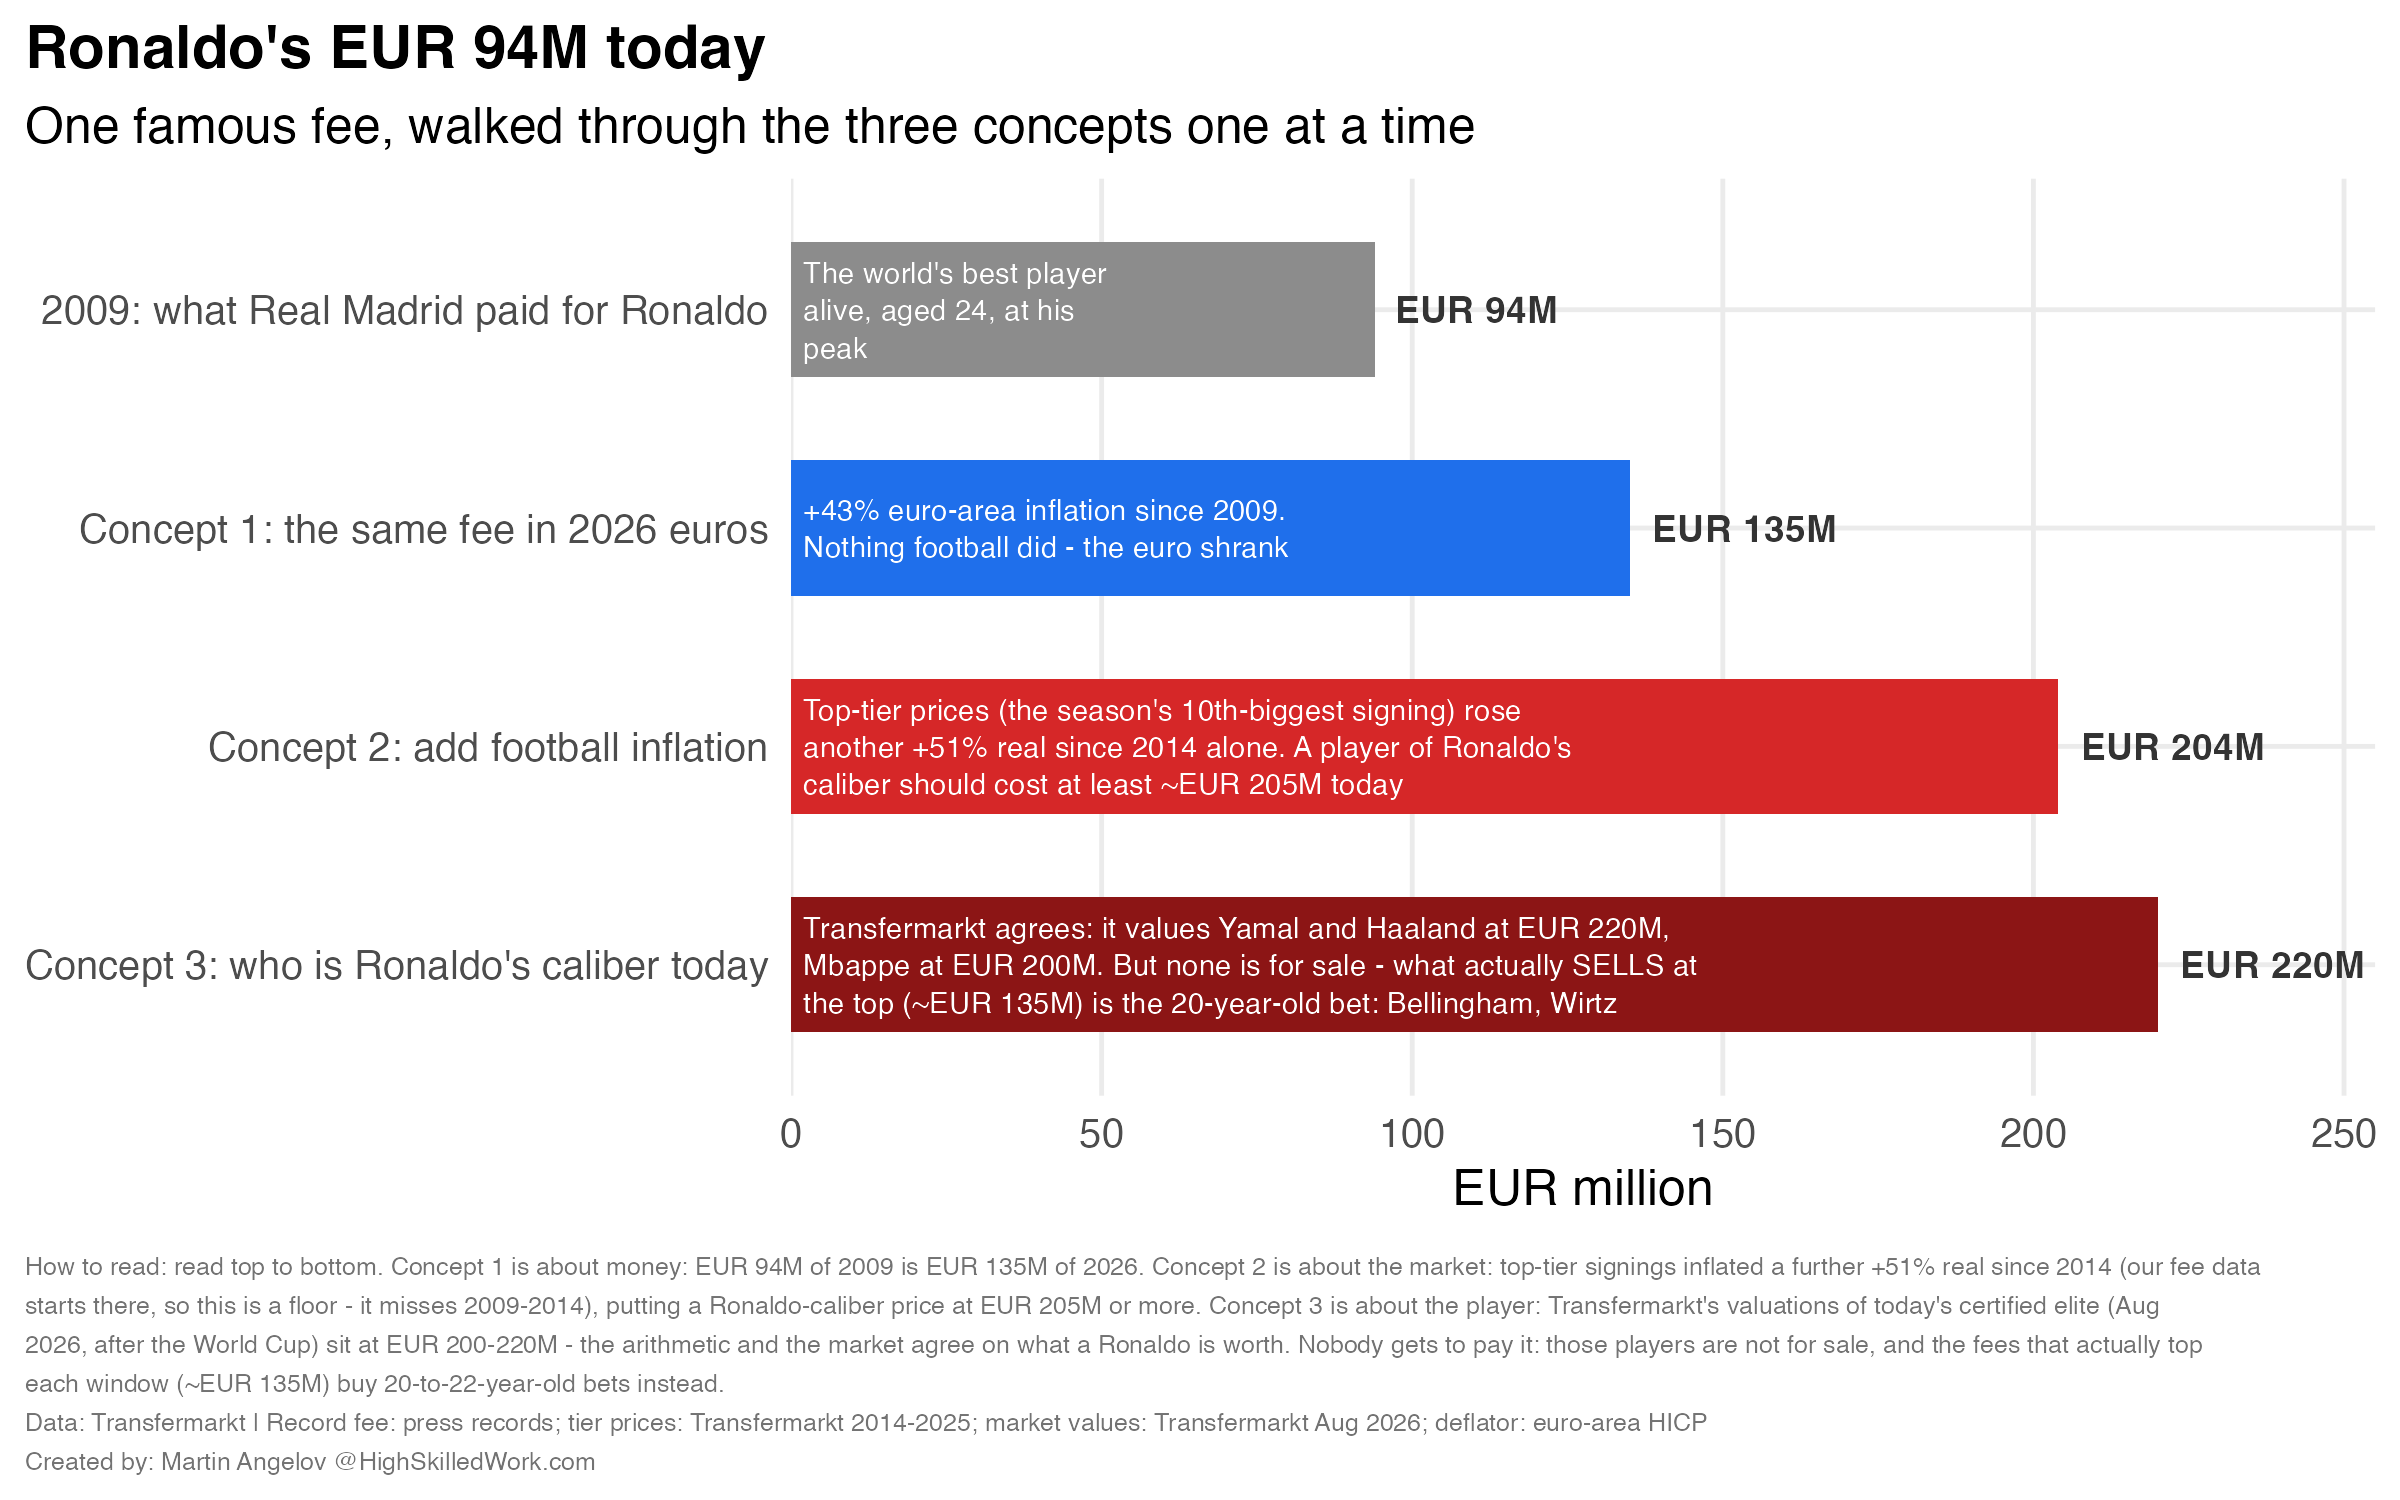
Concept 1 — the money. €94M of 2009 is €135M of 2026. That part has nothing to do with football.
Concept 2 — the market. Add football’s own inflation: top-tier signings rose another +51% real just since 2014 (my fee data starts there, so whatever happened between 2009 and 2014 comes on top). A player of that caliber should cost €200M+ in today’s market. Not a precise valuation — a magnitude.
Concept 3 — the product. Players worth that kind of fee still exist. Transfermarkt currently values Yamal and Haaland at €220M, Mbappé at €200M — almost exactly where the arithmetic lands. But none of them is for sale. What actually tops each window is €120–140M real, spent on the 20-to-22-year-old who might become them.
Boom — that was football inflation 101.
The next time someone tells you prices went crazy — for players, for houses, for engineers, for eggs — ask three questions:
Did the money change? Did the market change? Did the product change?
Most football posts fail at least two if not all three checks in a single meme.
Now you know better.
Talk soon,
Martin
P.S. This post was AI-assisted for editing and code debugging. Thanks to AI, my productivity curve also looks like the Premier League’s TV deal. My revenue curve, sadly, does not.