

In 2020, Kevin De Bruyne had a problem that money usually solves — and a second problem that made the first one considerably worse.
His contract with Manchester City was running down, and the club’s opening offer would have left him earning less than before.
The person who would normally fight that battle for him — his agent — was in prison.
So De Bruyne did something unusual. He negotiated without an agent and hired a data consultancy to help build his case.
The consultancy was Analytics FC, then a six-person firm. The engagement was so unusual that the service effectively did not exist before De Bruyne asked for it.
The result came in April 2021: a new Manchester City contract reportedly worth around €80 million, representing a raise of roughly 30%.
The story itself is now well known. It’s even taught at Harvard Business School (HBS). What's less public and what interested me was something else:
What did the data scientists actually build?
The HBS case describes a series of analyses designed to answer four questions:
How good was De Bruyne relative to the market?
What would Manchester City have to spend to replace him?
Which other clubs could realistically afford and use him?
Most importantly: what was De Bruyne worth specifically to Manchester City?
So I tried to rebuild them all.
Everything below uses information that was available around the time of the negotiation. Performance data comes from Opta, wage estimates from Capology, and the analytical framework follows the methods described in the HBS case study.
The result is about as close as I can get, from outside the club, to reconstructing De Bruyne’s negotiation pack.
Let’s get into it.
Why De Bruyne needed data scientists in the first place?
Before rebuilding the tools, it helps to understand the negotiation process.
A player under contract is an asset. Manchester City had bought De Bruyne from Wolfsburg in 2015 for around €76M and signed him to a six-year contract.
But contracts are wasting assets. As expiry approaches, the transfer fee another club would need to pay falls. Eventually the contract reaches zero and the player can leave for free.
That clock creates leverage on both sides.
The player can say: extend me now, or risk losing me for nothing.
The club can say: you are getting older, so perhaps we let the contract run down and replace you.
That is why renewals often happen with roughly two years remaining, while both threats still matter.
The problem for De Bruyne was that most of the other advantages belonged to City.
The club had proprietary performance data. It had professional negotiators. Sporting directors handle contract discussions constantly; a player may do it only a handful of times during his career.
Normally an agent absorbs that asymmetry. De Bruyne did not have one.
There was another weakness in his position: he wanted to stay. By every account, he wanted to remain at City and win the Champions League there.
That is not an especially convincing walk-away threat.
So the negotiation needed something else.
Rather than argue simply that De Bruyne was one of the best players in the world, his side needed to answer a more useful question:
What was keeping Kevin De Bruyne worth to Manchester City?
That is where the data scientists come in.
Tool #1: Benchmark him against the market
Was De Bruyne already being paid like the player he was?
The obvious place to start is with the market. Take every attacking player in Europe’s top five leagues and compare two things:
what they produce;
what they are paid.
For output, I use expected goal contribution per 90 minutes: non-penalty expected goals plus expected assisted goals.
Why expected numbers?
Because a contract prices the future. Actual goals can swing because of finishing. Actual assists depend partly on whether teammates convert the chances you create. Expected metrics strip out some of that noise and get closer to the underlying quality of the chances a player generates.
I also use three seasons rather than one. A long-term contract should price a sustained level rather than a single unusually good or bad year.
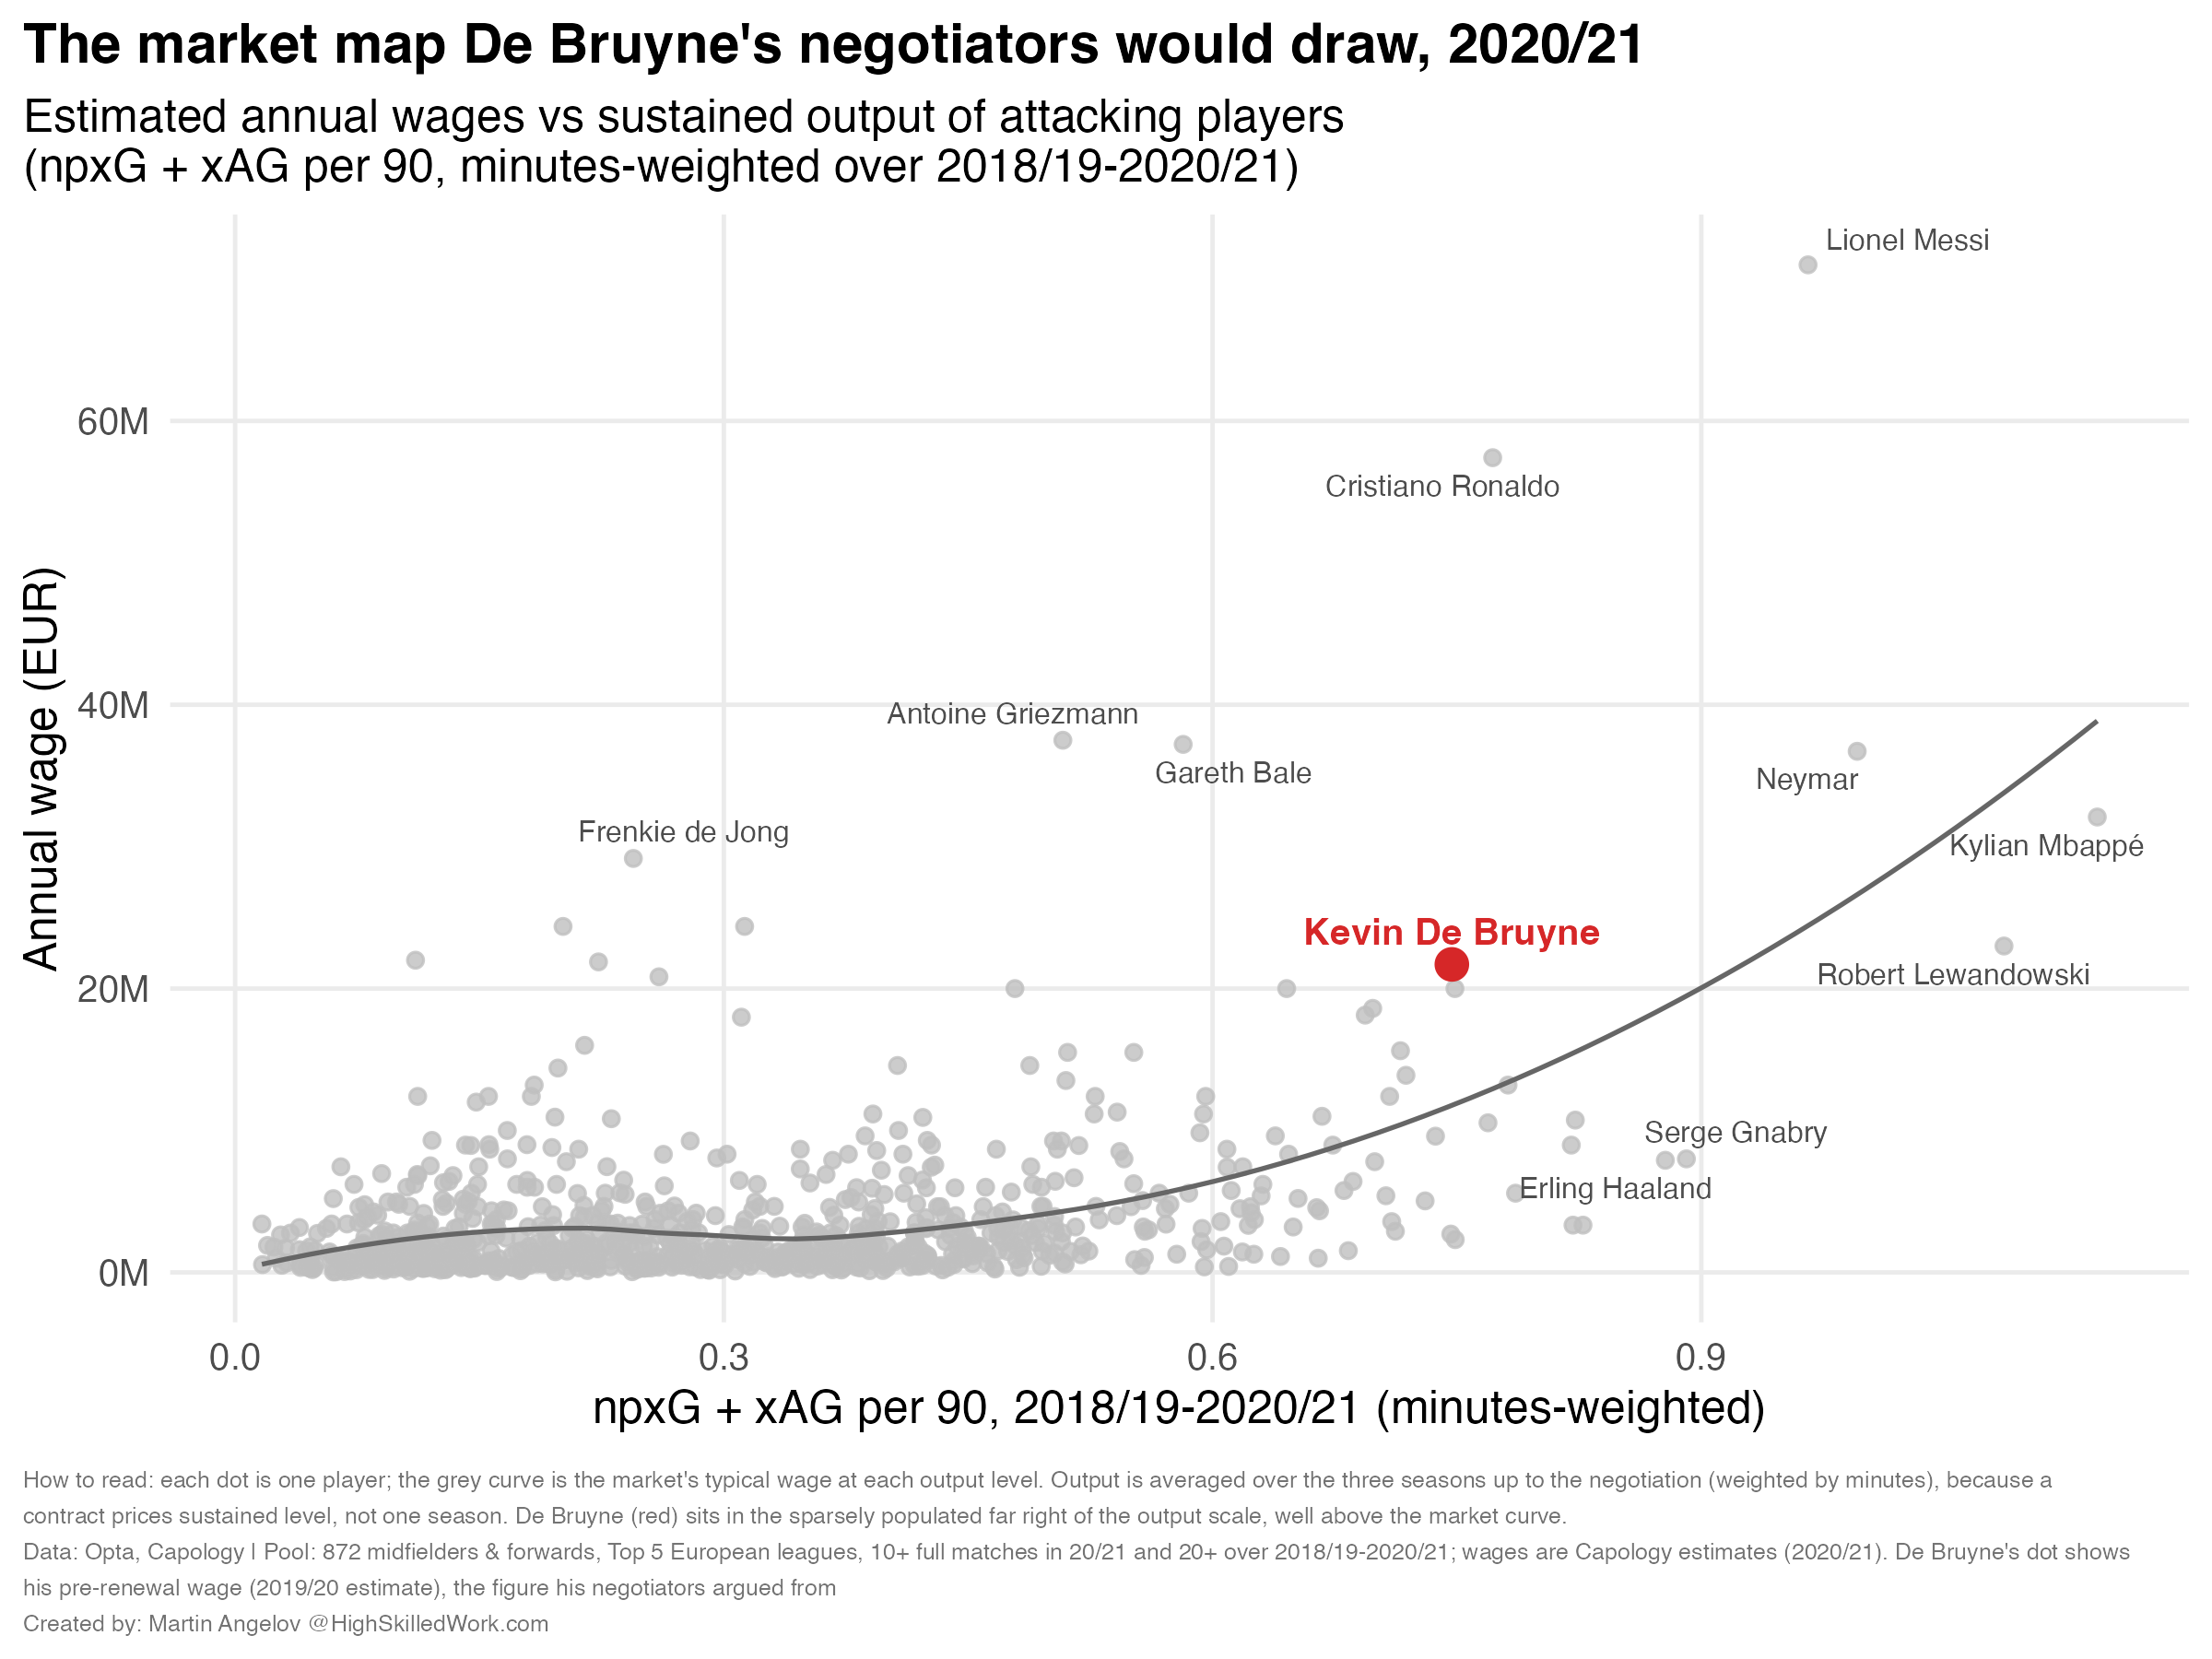
Over 2018/19 to 2020/21, De Bruyne produced approximately 0.75 expected goal contributions per 90 minutes. That put him around the 98th percentile among attacking players in Europe’s top five leagues.
Now look at wages. The median attacking player in this pool earned around €1.9M a year. Roughly two-thirds earned less than €3M.
But wages do not rise smoothly with performance. For most of the market they climb slowly. Then, among the final handful of players (the Messis, Ronaldos, Neymars, Mbappés), they go almost vertical.
The top ten players — barely one percent of the sample — captured more than 12% of all wages paid to the 872 players in the pool.
De Bruyne sat right at that edge.
His estimated pre-renewal salary of around £350k per week — roughly €22M annually — placed him in approximately the 98.5th wage percentile.
So the first piece of the negotiation case is almost perfectly symmetrical:
98th-percentile output.
98.5th-percentile pay.
He was being paid like one of the best attacking players in Europe because he was producing like one.
And that conclusion survives more sophisticated measurement. Using the twelve-metric creative profile from my previous article puts De Bruyne in the 99th percentile. Using the full 43-metric PCA fingerprint puts him around the 96th. One metric, twelve metrics or forty-three: the exact number moves, but the conclusion does not. De Bruyne lived at the extreme right-hand edge of the market.
Where normal salary benchmarking breaks
De Bruyne was already being paid like an elite player. His wage rank was almost perfectly aligned with his performance rank.
But there was still another level above him.
Messi, Ronaldo and Neymar were not simply top-percentile players. They occupied a different part of the wage distribution altogether — the extreme superstar tier where salaries stop rising gradually and jump sharply.
That was effectively the territory De Bruyne was trying to move toward.
So the question was no longer whether he deserved to be among Europe’s best-paid players. The data already showed that he was.
The harder question was: how much more should a club pay for the difference between an elite player and a true superstar?
To see what a conventional salary-benchmarking approach would say, I fitted a basic wage model using player-seasons from 2017/18 through 2020/21. The model learns what the market typically pays based on:
output;
minutes played;
age;
league;
the employing club’s wage bill.
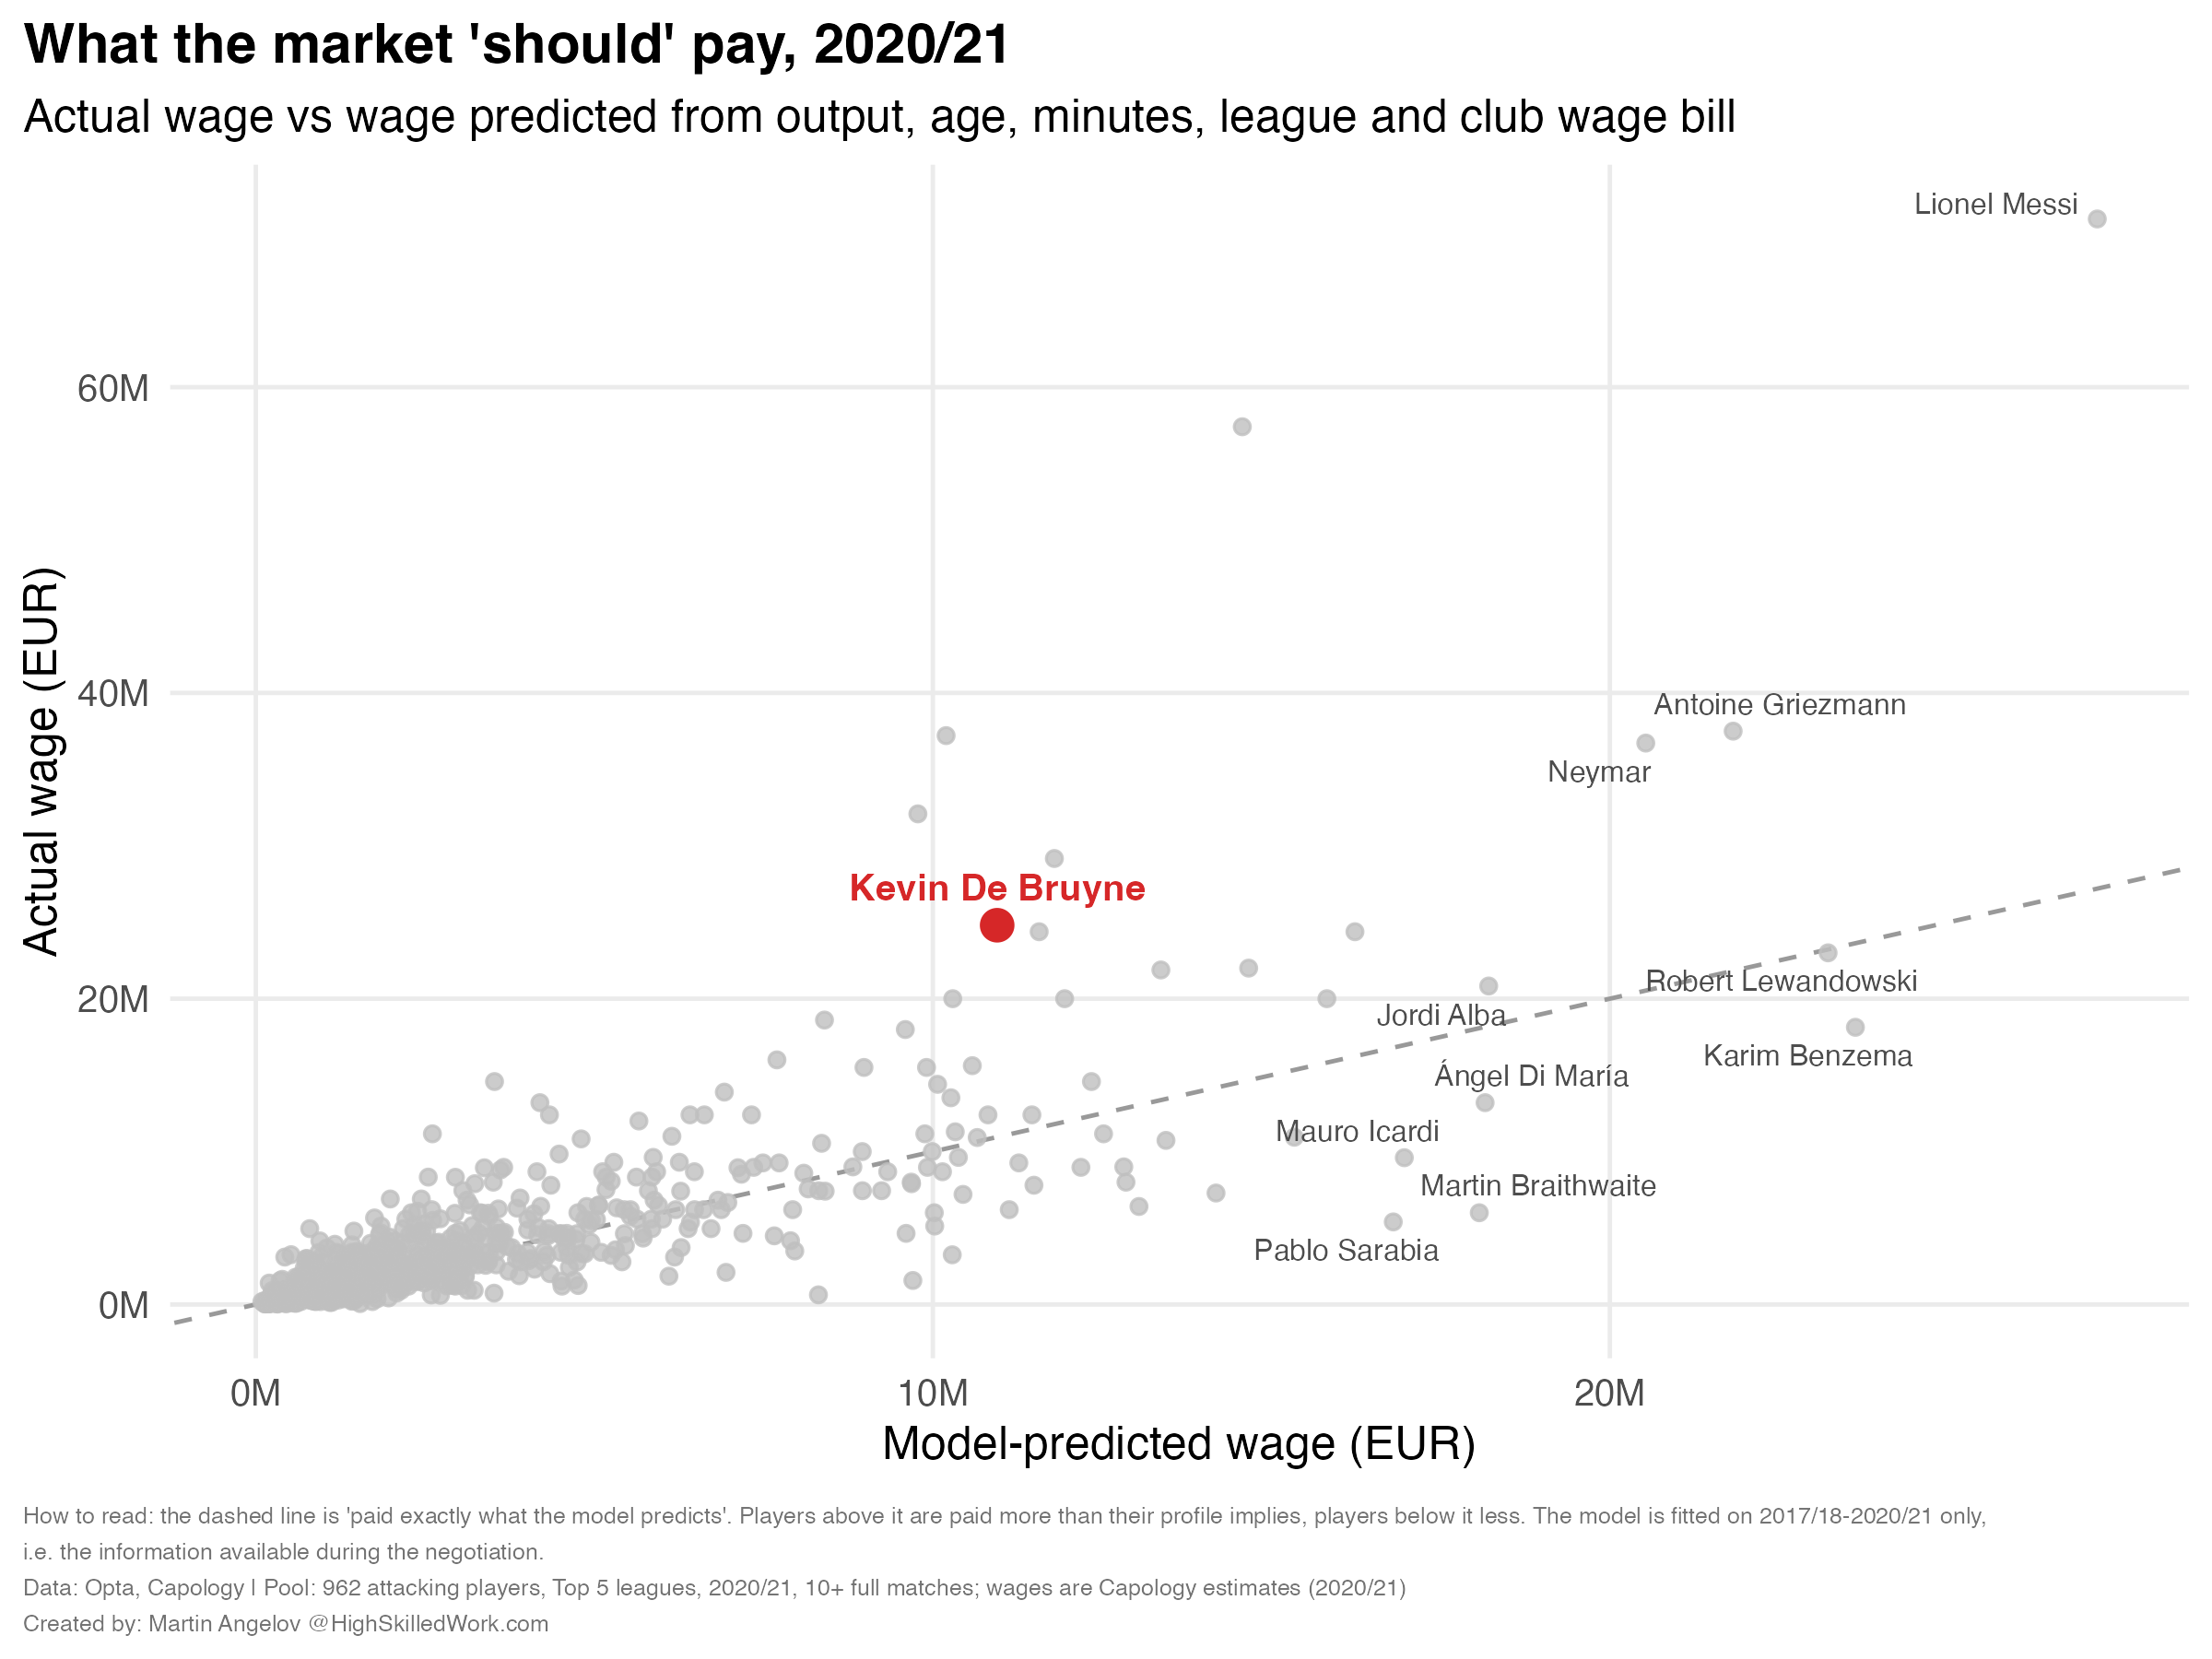
Economists would call this a hedonic model. HR departments use essentially the same logic when benchmarking salaries against comparable jobs.
The model explains around 70% of wage variation across Europe.
Then I ask it to price De Bruyne. Its answer: about €11M per year. His estimated actual salary was already more than twice that. By the model’s logic, De Bruyne was massively overpaid.
Change the specification and the problem remains. Use sustained three-season output: around €12M. Use the PCA-based profile score: around €14M. Still nowhere close.
Then look at the other players the model calls overpaid: Messi. Neymar. Ronaldo. Griezmann.
That tells us something important. When a model systematically concludes that the most valuable superstars in European football are all being paid far too much, it probably has not discovered a giant market inefficiency.
It is missing the way superstar markets work.
The value of moving from the 56th percentile to the 60th percentile is not the same as moving from the 95th to the 99th. At the top of football, small differences in quality can decide league titles and Champions League runs.
The prize money, commercial value and scarcity attached to those differences are enormous. A regression fitted across the whole labour market smooths that away.
And that is why ordinary salary benchmarking was never going to justify De Bruyne moving into the very top wage tier. To make that case, the negotiation had to stop asking what comparable players earned and start asking a different question:
What would losing Kevin De Bruyne actually cost Manchester City?
That leads to the second tool.
Tool #2: Price the replacement
What would Manchester City have to spend if De Bruyne left?
If City refused to pay De Bruyne, eventually they would need someone else to perform his role.
So who could actually replace him?
I started with every midfielder and forward in the top five leagues who played at least 15 full-match equivalents in 2020/21 — around 700 players. For each player I calculated twelve creative metrics per 90: key passes; expected assists; expected assisted goals; passes into the penalty area; passes into the final third; progressive passes; shot-creating actions; goal-creating actions; progressive carries; penalty-box touches; progressive passes received; non-penalty expected goals.
These metrics live on different scales, so each one is converted into a z-score: the number of standard deviations a player sits above or below the population average.
That gives every player a twelve-number creative fingerprint. Then I measured the distance between each fingerprint and De Bruyne’s. The smaller the distance, the more similar the player. And this is where the negotiation gets interesting.
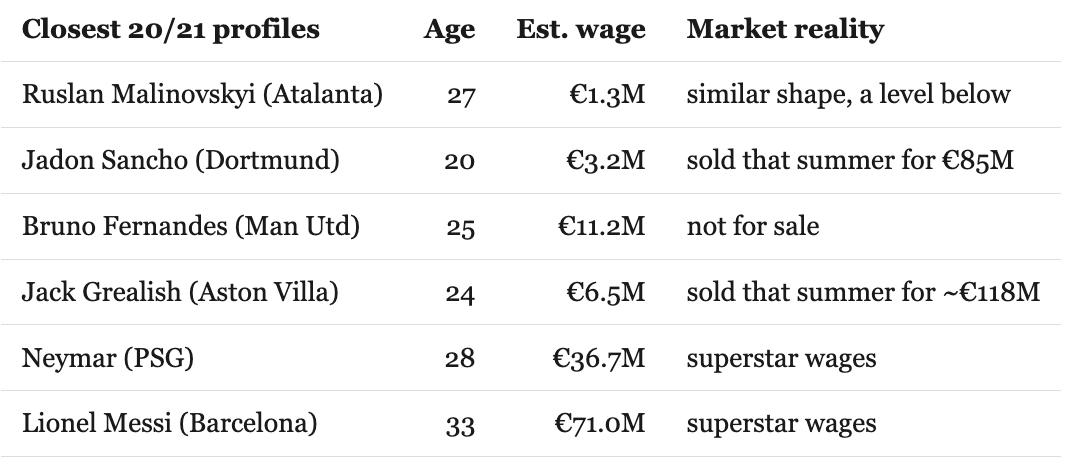
The closest genuine substitutes fell into two groups.
The first group contained players such as Messi and Neymar. They were clearly good enough. They were also already on superstar salaries or carried astronomical acquisition costs.
The second group contained much cheaper statistical lookalikes. Players such as Ruslan Malinovskyi could resemble De Bruyne in the shape of their output while earning a tiny fraction of his salary. But shape is not level. They were producing less, at weaker teams, without evidence that the performance would survive the jump to a title-winning environment.
The market understood that difference.
And perhaps the cleanest evidence came from Manchester City themselves.
A few months after De Bruyne signed his new contract, City paid around €118M for Jack Grealish — one of the players my model identifies as relatively close to De Bruyne’s creative profile. Grealish was still a step down in output. City themselves had therefore provided a useful market price for acquiring a high-level De Bruyne-type player.
There was no cheap version of Kevin De Bruyne. And once transfer fees enter the calculation, paying the existing player another few million a year starts looking very different.
What this gave De Bruyne: City could save on salary only by exposing themselves to a much larger replacement cost.
Tool #3: Map his outside options
Who could actually afford him — and who would need him?
Replacement cost tells City what happens if De Bruyne leaves. But De Bruyne also needs a credible answer to another question:
Where could he go?
The case describes Analytics FC approaching this in layers.
First: affordability.
Then: tactical fit.
Then: squad composition.
A rich club with a 24-year-old star already occupying your role is not necessarily an attractive destination. A rich club whose chief creator is 32 may be.
So instead of asking which clubs liked De Bruyne, the analysis asks which clubs could both pay him and plausibly need him.
We can reconstruct part of that.
Assume a target salary of roughly €20M annually and use a simple wage-structure rule: one player should not consume much more than 10% of the club’s total wage bill. Only six clubs in Europe’s top five leagues at the time cleared that threshold: Barcelona, Real Madrid, Paris Saint-Germain, Manchester United, Bayern Munich; and Juventus.
Dozens of famous clubs could not pay him without materially distorting their wage structure. Then look at the chief creators at those six clubs in 2020/21.
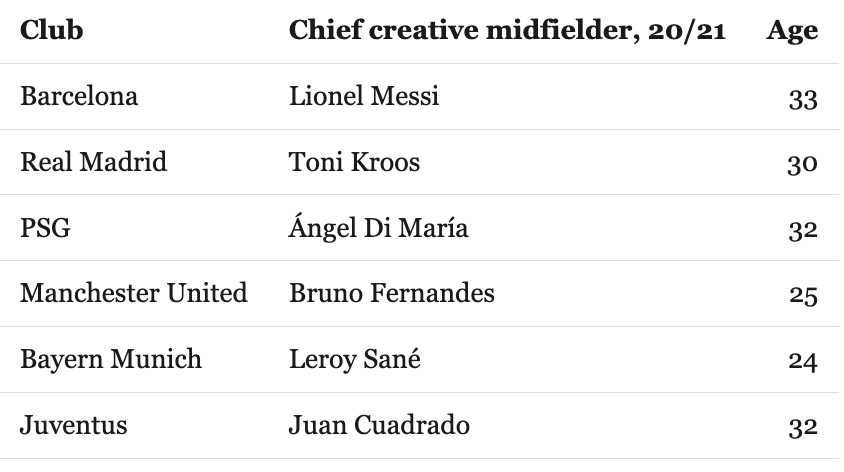
Manchester United had a 25-year-old Bruno Fernandes. Bayern Munich had a 24-year-old Leroy Sané. Neither had an obvious succession problem.
The remaining four did.
Barcelona, Real Madrid, PSG and Juventus were relying heavily on creators aged roughly 30 to 33. All four had the finances to pay De Bruyne. All four were approaching a point where succession planning in creative positions would become increasingly important.
De Bruyne did not need to walk into negotiations claiming:
Real Madrid are going to sign me.
He only needed to demonstrate that the outside market was real.
What this gave De Bruyne: evidence that the small group of clubs capable of matching his salary included several with a plausible need for exactly his type of player.
Tool #4: Turn De Bruyne into club revenue
What was he worth specifically to Manchester City?
Now the negotiation changes. So far, we have established that:
De Bruyne was producing at an extreme level;
replacing him would be expensive;
other elite clubs could plausibly afford him.
But Manchester City already knew De Bruyne was brilliant. Walking into a boardroom with another chart proving it does not necessarily change the offer. The more interesting method described in the HBS case converts football performance into something the board budgets directly: money.
The basic idea is simple.
Take Manchester City. Remove Kevin De Bruyne. Replace his minutes with a more ordinary player. Then simulate the season again and again.
How often do City still qualify for the Champions League? How often do they win the league? How much money changes hands when those probabilities move?
That is no longer an abstract player valuation. It is an estimate of what De Bruyne is worth to this particular club.
Price the player by deleting him
I rebuilt a simplified version of the chain.
Link 1: Player output → goals
For this link I use De Bruyne's 2020/21 rate — 0.67 expected goal contributions per 90, rather than his sustained 0.75 — because it is that specific season we are about to re-run. The median attacking player produces around 0.25. Over the equivalent of roughly 22 full matches, swapping De Bruyne for the median attacker removes around nine expected goals from City's season.
Link 2: Goals → points
Across eight completed seasons in Europe's top five leagues — 760 team-seasons — league points and goal difference have an extremely strong relationship. The relationship explains around 94% of the variation. On average, one additional goal of goal difference is associated with roughly 0.63 league points. So nine lost goals translate into approximately six lost points.
Link 3: Points → Champions League probability
Six points still sounds abstract. What matters is whether those points change the outcome of the season. So I simulated it.
Start with City’s actual 86 points in 2020/21. In one scenario, leave them untouched. In the other, remove the six points associated with replacing De Bruyne.
Then add random variation of roughly ±4 points — the typical gap, measured across those same 760 team-seasons, between a team’s actual points and what its goal difference predicts. That gap is the part of real football results the model can’t explain: close-game luck, red cards, deflections and everything else that moves seasons around.
Each simulation also draws a different Premier League fourth-place threshold from historical seasons. Sometimes Champions League qualification requires 66 points. Sometimes 75. Run 10,000 simulated seasons in each scenario and count how often City finish above the line.
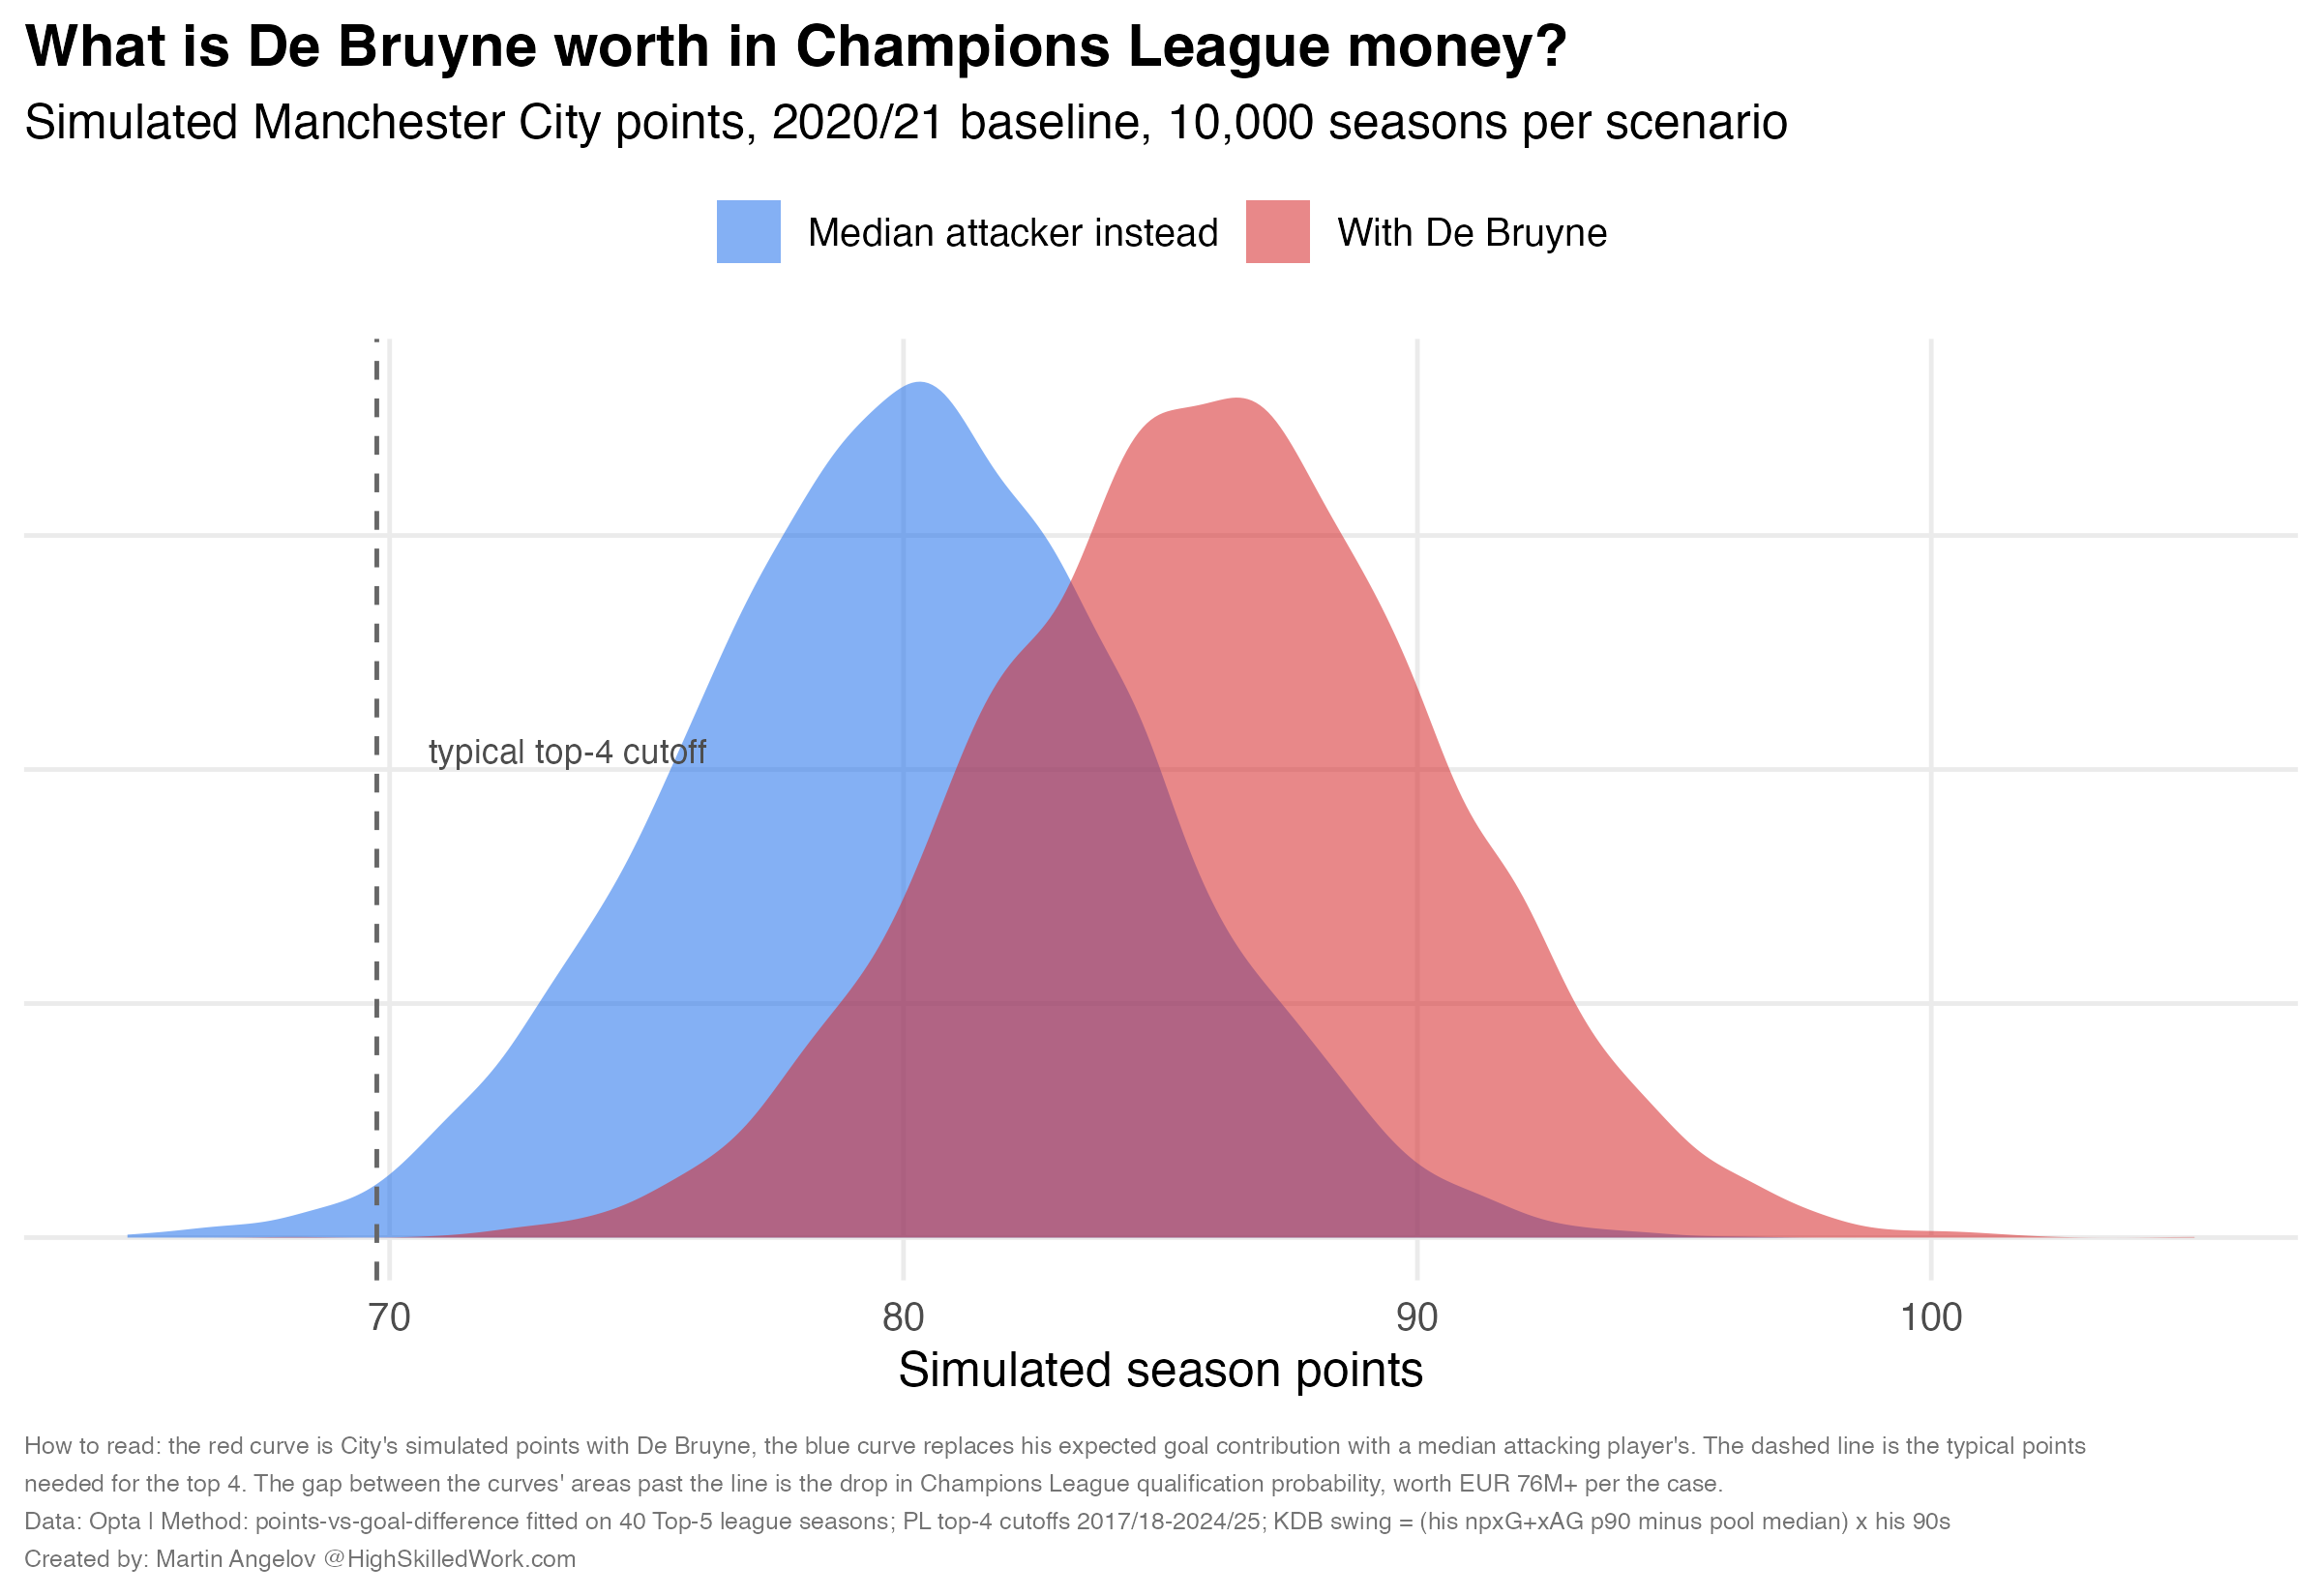
The result:
With De Bruyne: 99.8% Champions League qualification probability.
With a median attacker replacing him: 96.9%.
Roughly a 3 percentage-point difference.
The HBS case reports Analytics FC obtaining a figure of approximately five percentage points from this kind of analysis. Given the differences between their internal model and my public-data reconstruction, getting into roughly the same range is encouraging. Their model was considerably richer. Mine uses season-level totals and a simplified goals-to-points bridge. They also ran their analysis while the season was still happening. I have the unfair advantage of knowing City eventually finished on 86 points.
Three percentage points of what?
This is where the exercise becomes more interesting. According to the case, Champions League qualification was worth at least €76M. Multiply that by three percentage points and you get only around: €2.3M per year.
That does not justify a €20M salary. So did the signature argument fail?
Not really.
The number is small because Manchester City were too good in 2020/21 for De Bruyne’s qualification value to be large.
They won the league by twelve points. Remove six points and they are still comfortably inside the Champions League places.
Now run exactly the same exercise for a 70-point team sitting near the qualification boundary. The result changes dramatically. Deleting those nine expected goals moves Champions League qualification probability from roughly 53% to 15%. That is a 38-point swing.
Multiply that by €76M and the same player’s contribution is suddenly worth around €29M a year from Champions League qualification alone.
Same player. Same performance. Completely different financial value. That gives us perhaps the most important idea in the entire case:
Player value is not just a property of the player. It is a property of the player-club combination.
And Manchester City’s own history shows the same thing.
Two seasons earlier, City won the Premier League with 98 points. Liverpool finished on 97. In a race that tight, a six-point player is not merely useful. Run the same simulation around that margin and City’s title probability falls from around 56% to 22% when those points disappear.
That is the difference between something close to a coin flip and something closer to a long shot.
And Champions League qualification is only one revenue line. In 2020/21, reaching the Champions League last 16 added around €9.5M. The quarter-final added roughly €10.5M. The semi-final another €12M. The final another €15M. That is approximately €47M of progression money beyond qualification, before coefficient and broadcast-pool payments.
City reached their first Champions League final that season, with De Bruyne captaining the team during the run. Then add Premier League merit payments, domestic competitions and the commercial value associated with a franchise player.
No single number needs to justify the whole contract. The point is to change the unit of the negotiation. The conversation is no longer:
What does a comparable midfielder earn?
It becomes:
What does Manchester City risk losing if Kevin De Bruyne is not here?
That is a much more favourable question for Kevin De Bruyne.
The negotiation pack, assembled
Put the four tools together and the case becomes much clearer.
Market benchmark : De Bruyne’s performance sat around the 98th percentile of elite European attackers. His wage sat around the 98.5th. He was paid like an exceptional player because he produced like one.
Replacement cost : The true substitutes were either superstars themselves or carried enormous transfer costs. A few months later, Manchester City paid €118M for Jack Grealish. Keeping De Bruyne was expensive. Replacing him could be far more expensive.
Outside options : Only a handful of European clubs could realistically afford his target salary. Several of them were approaching obvious creative succession problems. His alternatives were limited — but credible.
Club-specific value : Removing De Bruyne from City reduced the probability of financially important outcomes. More importantly, the exercise changed the frame of the negotiation from salary benchmarking to financial value and replacement risk.
The data did not need to prove that Kevin De Bruyne was good. Everyone in the room already knew that. It needed to give De Bruyne a way to negotiate against a club that possessed more information, more experience and more institutional power than he did.
Instead of saying “I deserve more because I am one of the best players in the world”, the analysis allowed him to say something closer to:
Here is what replacing me costs.
Here is who else could afford me.
Here is what my presence does to your probability of winning things.
And here is what those outcomes are worth.
In April 2021, Manchester City agreed a new deal running to 2025, reportedly worth around €80M.
According to the case study, De Bruyne had entered negotiations facing an offer that would reduce his pay. And yet, he left with a substantial raise.
Boom — that was my take on Kevin De Bruyne’s use of data scientists.
Kevin De Bruyne’s use of data is another perfect example of High-Skilled Work in practice: combining performance metrics with financial data to move beyond describing how good someone is and towards quantifying what that performance is actually worth.
In this case, that meant linking football output to wages, replacement costs, outside options and ultimately the financial value De Bruyne created for Manchester City. The interesting part is not any single model, but how different analytical tools can be combined to answer a real commercial question.
The original Analytics FC report clearly contained more analysis than I could reproduce here from public data. It goes without saying that this piece is a reconstruction of the main ideas described in the case study, not a replica of the full report.
If you want to go deeper into the project itself, I’d highly recommend Chris Gill’s interview with Analytics FC’s Jeremy Steele, as well as the original Harvard Business School case study. Both are brilliant.
I hope you enjoyed reading this deep dive as much as I enjoyed putting it together.
Thanks for reading all the way to the end.
Talk soon,
Martin
P.S. This post was AI-assisted for editing and code debugging. Kevin De Bruyne’s contract was not. But maybe the next one will be.
A note on football wages. Football salaries are not public records, so Capology’s figures are estimates. They also disagree with the HBS case on one important point. Capology has De Bruyne moving from roughly £350k to £400k per week — about a 14% increase — while the case study and contemporaneous reporting describe something closer to 30%. Both cannot be exactly right.
The likely explanation is that public estimates capture base salary more accurately than the full economics of an elite contract: signing bonuses, image rights and performance clauses can materially change the package. There is a similar disagreement on contract length. The HBS case describes five years, while Manchester City’s announcement and contemporary reporting say the agreement ran to summer 2025 — four more seasons — which is also when De Bruyne ultimately left.
For market comparisons, the precise number matters less because every player is being measured from the same public wage source. The individual figures should still be treated as approximate.